Isotopic Constraints on Earth System Processes
Здесь есть возможность читать онлайн «Isotopic Constraints on Earth System Processes» — ознакомительный отрывок электронной книги совершенно бесплатно, а после прочтения отрывка купить полную версию. В некоторых случаях можно слушать аудио, скачать через торрент в формате fb2 и присутствует краткое содержание. Жанр: unrecognised, на английском языке. Описание произведения, (предисловие) а так же отзывы посетителей доступны на портале библиотеки ЛибКат.
- Название:Isotopic Constraints on Earth System Processes
- Автор:
- Жанр:
- Год:неизвестен
- ISBN:нет данных
- Рейтинг книги:4 / 5. Голосов: 1
-
Избранное:Добавить в избранное
- Отзывы:
-
Ваша оценка:
Isotopic Constraints on Earth System Processes: краткое содержание, описание и аннотация
Предлагаем к чтению аннотацию, описание, краткое содержание или предисловие (зависит от того, что написал сам автор книги «Isotopic Constraints on Earth System Processes»). Если вы не нашли необходимую информацию о книге — напишите в комментариях, мы постараемся отыскать её.
Volume highlights include: Isotopic Constraints on Earth System Processes
The American Geophysical Union promotes discovery in Earth and space science for the benefit of humanity. Its publications disseminate scientific knowledge and provide resources for researchers, students, and professionals.
Isotopic Constraints on Earth System Processes — читать онлайн ознакомительный отрывок
Ниже представлен текст книги, разбитый по страницам. Система сохранения места последней прочитанной страницы, позволяет с удобством читать онлайн бесплатно книгу «Isotopic Constraints on Earth System Processes», без необходимости каждый раз заново искать на чём Вы остановились. Поставьте закладку, и сможете в любой момент перейти на страницу, на которой закончили чтение.
Интервал:
Закладка:
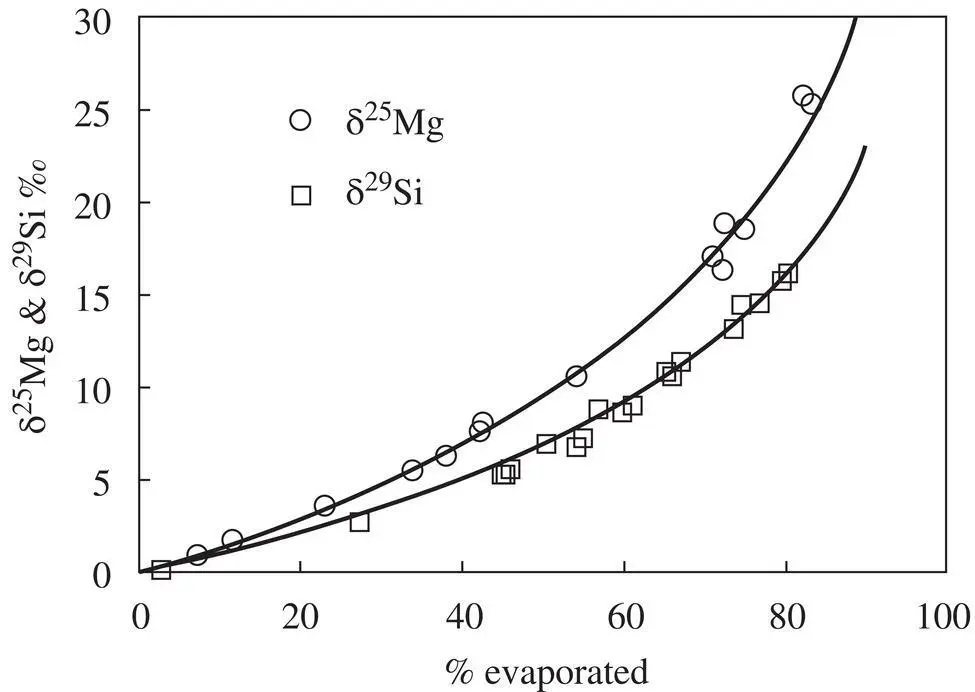
Figure 1.17 The unfilled circles and squares are the isotopic fractionation of magnesium and silicon in vacuum evaporation residues of a CAI‐like melt from experiments by Richter et al. (2007) for magnesium and Knight et al. (2009) for silicon. The black curved lines through the data are Rayleigh fractionation trajectories calculated as described in the text.
1.6.4. Evidence of Evaporation in Natural CAIs from Chondritic Meteorites
The correlated isotopic fractionation of magnesium and silicon in CAIs led to the suggestion that their precursors were melted by a transient heating event during which their more volatile components, MgO and SiO 2, were partially lost by evaporation (see discussion in Grossman et al., 2000; Richter et al. 2002). The best evidence for this comes from comparing the correlation between the magnesium and silicon isotopic fractionation of laboratory evaporation residues with that of actual CAIs (see Fig. 1.18). The δ 29Si versus δ 25Mg data from the natural CAIs are somewhat scattered but there is a definite trend of larger silicon isotope fractionation being associated with larger magnesium isotope fractionation. The scatter can, for the most part, be explained by the precursor of each CAI having a somewhat different Mg/Si composition. The more silicon‐rich the precursor the faster silicon evaporates initially compared to magnesium and as a result the δ 29Si versus δ 25Mg trajectory will be somewhat more δ 29Si‐rich than for the evaporation residue of a less silicon‐rich precursor. The same applies to the magnesium isotopic fractionation of precursors with more or less MgO compared to SiO 2. Overall the comparison of the isotopic fractionation of silicon versus magnesium of evaporation residues from experiments with the trend of the natural CAI fractionations is persuasive evidence that many CAIs did indeed evaporate some fraction of their initial silicon and magnesium. Once one is persuaded that CAIs with correlate silicon and magnesium isotopic fractionation are evaporation residues, their isotopic fractionation, together with experimental values for α Mgand α Siin the Rayleigh fractionation equation, can be used calculate the fraction of silicon and magnesium that evaporated. Knight et al. (2009) used this approach to estimate of how much MgO and SiO 2had evaporated from particular CAIs to calculate the bulk composition of their precursors and make a more detailed comparison with the predictions of the bulk composition of condensates from a solar composition gas. Richter et al. (2006a) gives several examples of how the experimentally determined evaporation kinetics and associated isotopic evolution of evaporation residues can be used to calculate detailed trajectories of CAIs in time‐temperature‐bulk composition space. These trajectories show that the precursors of CAIs were reheated and partially molten for at most a few hours. A nebular shockwave was a plausible process responsible for the short‐duration heating event (see Fig. 9 in Richter et al., 2006a)
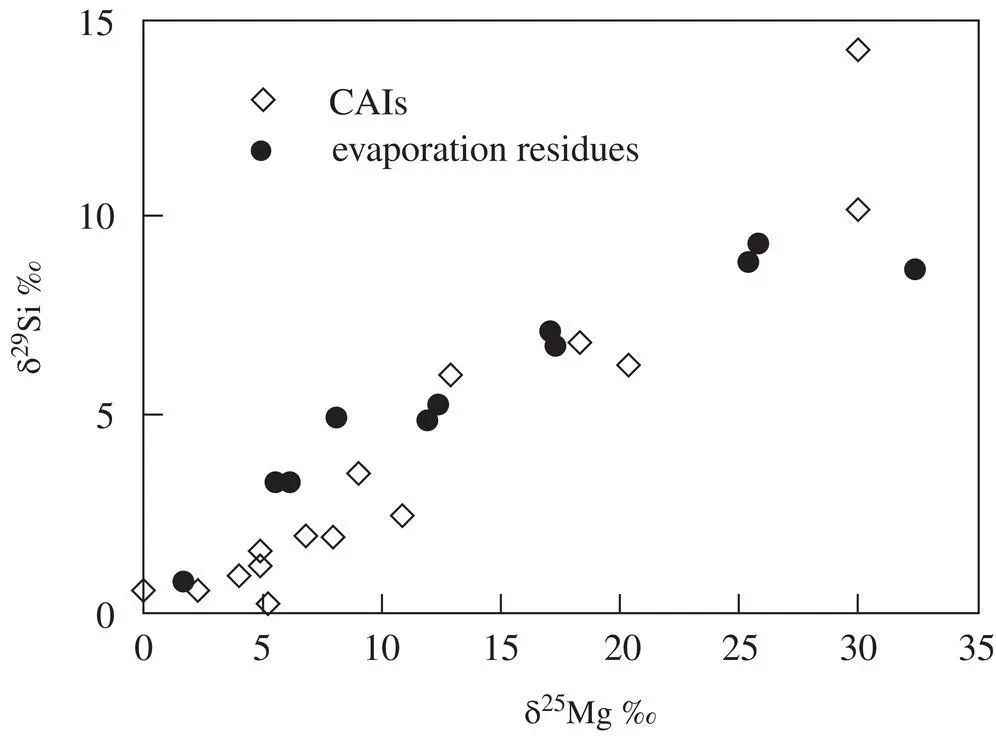
Figure 1.18 This figure compares the correlation of the silicon and magnesium isotopic fractionation of vacuum evaporation residues using data from Richter et al. (2007) and Knight et al. (2009) with isotope fractionation data from natural CAIs listed in Table 2 of Clayton et al. (1988).
1.7. SUMMARY
Sections 1.3and 1.5discussed experimental evidence of isotope fractionations associated with chemical diffusion at high temperature in both silicate liquids and silicate minerals, along with examples of analogous kinetic isotope fractionations in materials from natural settings. The purpose of the chemical diffusion experiments was to determine the relative magnitude of the effective diffusion coefficients D iand D jof isotopes of atomic mass m iand m jwith the results parameterized by an exponent β in relationship 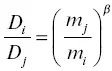 . Table 1.1gives a summary of β values for different isotope pairs in different silicate melts and minerals. The experiments by Watkins et al. (2009 and 2011) are noteworthy in showing that the kinetic isotope fractionation exponents β in silicate liquids for calcium are very different depending on the composition of the liquid. Watkins et al. (2014) also showed that β can depend on the direction of diffusion in composition space. This evidence of the complexity of kinetic isotope fractionation in silicate liquids reinforces the importance of carrying out diffusion experiments with materials from a natural setting to determine effective diffusion coefficients for modeling the elemental and isotopic fractionations measured in rocks from the natural setting. Chopra et al. (2012) exemplify this approach in their study of isotopic fractionation across contacts between silicic and mafic rock from the Vinalhaven igneous complex in Maine. There are several other studies of kinetic isotope fractionation by diffusion in condensed systems that are not listed in Table 1.1, but which might be of interest to some readers. These include experiments documenting isotope fractionation of ions diffusing in water (Bourg et al., 2010; Richter et al., 2006b) and isotopic fractionation of iron and nickel isotopes by diffusion in Fe–Ni alloys (Watson et al., 2016).
Table 1.1 Summary of the exponents β from laboratory diffusion experiments with silicate melts and minerals.
| Silicate Melts | Isotopes | β | Reference |
|---|---|---|---|
| CaO‐Al 2O 3‐SiO 2 | 48Ca – 40Ca | 0.05, 0.1 | Richter et al., 1999 |
| CaO‐Al 2O 3‐SiO 2 | 76Ge – 70Ge | < 0.025 | Richter et al., 1999 |
| Rhyolite‐basalt | 44Ca – 40Ca | 0.05 | Richter et al., 2003 |
| Rhyolite‐basalt | 7Li – 6Li | 0.215 | Richter et al., 2003 |
| Rhyolite‐basalt | 26Mg – 24Mg | 0.05 | Richter et al., 2008 |
| Rhyolite‐basalt | 56Fe – 54Fe | 0.03 | Richter et al., 2009b |
| Rhyolite‐basalt | 44Ca – 40Ca | 0.035 | Watkins et al., 2009 |
| Rhyolite‐Ugandite | 44Ca – 40Ca | 0.035 | Watkins et al., 2009 |
| Albite‐anorthite | 44Ca – 40Ca | 0.021 | Watkins et al., 2011 |
| Albite‐diopside | 44Ca – 40Ca | 0.165 | Watkins et al., 2011 |
| Albite‐diopside | 26Mg – 24Mg | 0.10 | Watkins et al., 2011 |
| Granite‐Basalt | 26Mg – 24Mg | 0.040, 0.045 | Chopra et al., 2012 |
| Wet rhyolite | 7Li – 6Li | 0.228 | Holycross et al., 2018 |
| Silicate Minerals | |||
| Augite | 7Li – 6Li | 0.35±0.1 | Richter et al., 2014b |
| Olivine | 7Li – 6Li | 0.04±0.1 | Richter et al., 2016 |
| Olivine | 56Fe – 54Fe | 0.09±0.05 | Sio et al., 2018 |
Note: Uncertainties are listed for β Liin augite and olivine because they are much larger than in the case of liquids, reflecting the complexity of multiple‐site lithium diffusion in these minerals. The uncertainty of β Fewas given by Sio et al. (2018).
Читать дальшеИнтервал:
Закладка:
Похожие книги на «Isotopic Constraints on Earth System Processes»
Представляем Вашему вниманию похожие книги на «Isotopic Constraints on Earth System Processes» списком для выбора. Мы отобрали схожую по названию и смыслу литературу в надежде предоставить читателям больше вариантов отыскать новые, интересные, ещё непрочитанные произведения.


Обсуждение, отзывы о книге «Isotopic Constraints on Earth System Processes» и просто собственные мнения читателей. Оставьте ваши комментарии, напишите, что Вы думаете о произведении, его смысле или главных героях. Укажите что конкретно понравилось, а что нет, и почему Вы так считаете.