Advanced Analytics and Deep Learning Models
Здесь есть возможность читать онлайн «Advanced Analytics and Deep Learning Models» — ознакомительный отрывок электронной книги совершенно бесплатно, а после прочтения отрывка купить полную версию. В некоторых случаях можно слушать аудио, скачать через торрент в формате fb2 и присутствует краткое содержание. Жанр: unrecognised, на английском языке. Описание произведения, (предисловие) а так же отзывы посетителей доступны на портале библиотеки ЛибКат.

- Название:Advanced Analytics and Deep Learning Models
- Автор:
- Жанр:
- Год:неизвестен
- ISBN:нет данных
- Рейтинг книги:5 / 5. Голосов: 1
-
Избранное:Добавить в избранное
- Отзывы:
-
Ваша оценка:
Advanced Analytics and Deep Learning Models: краткое содержание, описание и аннотация
Предлагаем к чтению аннотацию, описание, краткое содержание или предисловие (зависит от того, что написал сам автор книги «Advanced Analytics and Deep Learning Models»). Если вы не нашли необходимую информацию о книге — напишите в комментариях, мы постараемся отыскать её.
The book provides readers with an in-depth understanding of concepts and technologies related to the importance of analytics and deep learning in many useful real-world applications such as e-healthcare, transportation, agriculture, stock market, etc.
Audience
Advanced Analytics and Deep Learning Models — читать онлайн ознакомительный отрывок
Ниже представлен текст книги, разбитый по страницам. Система сохранения места последней прочитанной страницы, позволяет с удобством читать онлайн бесплатно книгу «Advanced Analytics and Deep Learning Models», без необходимости каждый раз заново искать на чём Вы остановились. Поставьте закладку, и сможете в любой момент перейти на страницу, на которой закончили чтение.
Интервал:
Закладка:
The author provides a brief overview of how a random wooded algorithm is use for retrofitting and phase, power boost, and bag loading used as methods. It generates a lot of distinctions, and the difference between lifting and bagging as stated by Liaw et al. (2002) is the successive trees, calculating the weights of the objects and most will take predictions. Throughout the year 2001, Nghiep and Al (2001) proposed a randomized start-up that included fundraising and provided more randomly the entire random planning and postponement process, which is mentioned here in retrospect.
Eric Slone et al. (2014) improved the relationship among the various home factors and the number of residential queries analyzed using a simple linear regression and multiple linear regressions using a standard square method. Home square images have been used as descriptive variables in simple queues, and multi-line retouches include an increase in the measurement of the parcel of land, number of bedrooms, year of construction, and more descriptive.
2.3 Proposed Work
2.3.1 Methodology
There are classified websites where properties are inconsistent in terms of pricing of an apartment, and there are some cases where similar apartments are priced at different price point, and thus, there are a lot of intransparencies. Sometimes, the consumers feels that the pricing is not justified for a particular listed apartment, but there no way to confirm that either. We propose to use three machine learning algorithms: linear regression, LASSO regression, and decision tree algorithm. The tools required for the project are as follows: Python, Sklearn for model building, Jupyter notebook, visual studio code and Pycharm as IDE, Python flask for http server, HTML/CSS/Javascript for UI, Numpy and Pandas for data cleaning, and Matplotlib for data visualization.
2.3.2 Work Flow
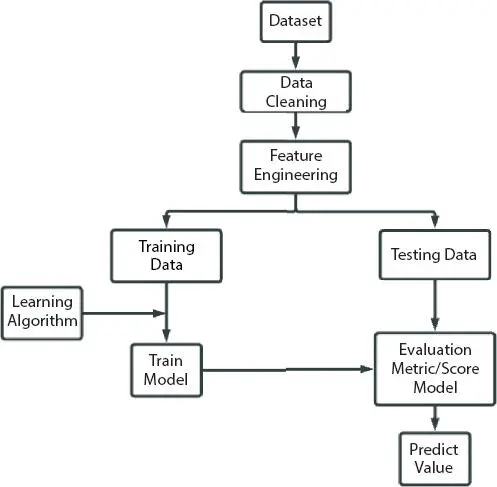
Figure 2.1Flow of work.
2.3.3 The Dataset
The selected dataset has element of the metropolis Bengaluru; it consists of nine columns with contents that is point out under in Table 2.1and has 13,321 instances. Enforcement of real estate, infidelity in real estate builders inside the city, and actual property sales throughout India in 2017 have dropped by 7%. As an example, for a potential house owner, greater than 9,000 apartments and flats for sale vary between 42 and 52 lakh, and it is observed that more than 7,100 apartments are within the budget 52 to 62 lakh, in step with a property file website Makaan.
Table 2.1 Columns of dataset.
| Column name | Description |
|---|---|
| Area type | The kind of area the flat/plot is in. |
| Availability | If the land is currently available or not. |
| Location | Location of the land/plot. |
| Size | Number of bedrooms and hall kitchen in the flat. |
| Society | Name of the cooperating society. |
| Total square feet | Area of the plot in square feet. |
| Bath | Number of bathroom in the flat. |
| Balcony | Number of balcony in the flat. |
| Price | Price of the plot/flat. |
2.3.4 Data Handling
2.3.4.1 Missing Values and Data Cleaning
First step is cleaning the data, for which we need to find the null values in the dataset. Figures 2.2and 2.3show the number of null values in every column. There are two methods of handling null value: first is that we can drop all the rows with null values, which will result in data loss; the other is that we could calculate the mean of all the values and replace all null values with the mean. Therefore, before cleaning the null value, we drop columns like society and balcony with multiple null values. Along with it, we also drop the columns like area type and availability, as our main goal is to predict the price.
In the size column, there are values with different attributes like 3 BHK and 3 BK, which means different; hence, to generalize, we will create a new column BHK. In this column, we would apply a function where we would tokenize each word; here, we keep the numbers and get rid of the other words. Therefore, we get a column BHK. In the total square feet column, there are entries where range is mention and not exact number; in this case, we replace it with the average of both the number.
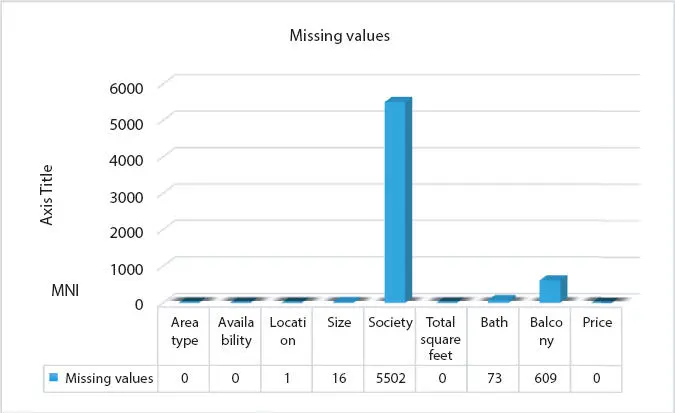
Figure 2.2 Missing values.
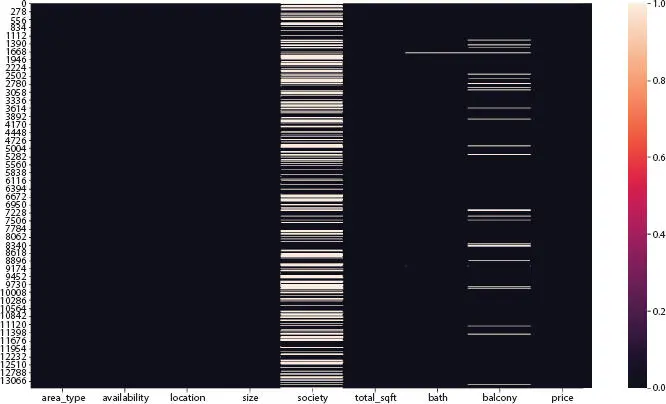
Figure 2.3 Visualizing missing values using heatmap.
2.3.4.2 Feature Engineering
Feature engineering is the base that will help us further to remove outliers. Here, we combine two columns, apply the formula, and get price per square feet. Then, we find the number of unique location where we get 1,304 locations. Here, some of the locations are just mentioned once or twice; therefore, we set a threshold of 10, so all the locations that appear over five times are considered Figure 2.4.
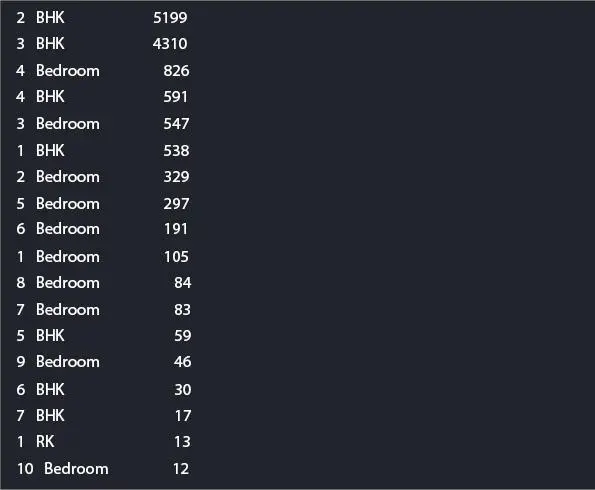
Figure 2.4 Different BHK attribute.
2.3.4.3 Removing Outliers
Outliers are data points or errors, which represent extreme variations in our dataset. There are techniques to detect outlier; one of them is by visualization. We can graph box plot or scatter plot and, from the patterns, draw inference.
In BHK, there are some flat whose average area of one room is larger, which appears unusual, whereas in some instances, the number of bathroom is larger than number of rooms in the house, hence affecting the result.
The scatter chart was plotted to visualize price per square feet for 2 BHK and 3 BHK properties. Here, the blue points represent the 2 BHK and red points as 3 BHK plots. Based on Figures 2.5through 2.8the outliers was remove from the Hebbal region using the “remove bhk outliers function”.
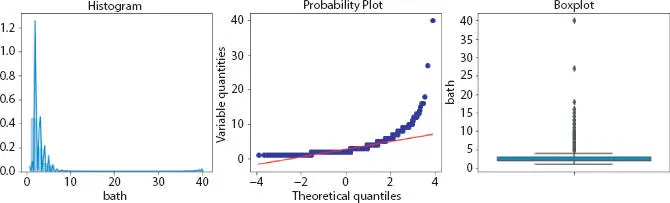
Figure 2.5 Bath visualization.
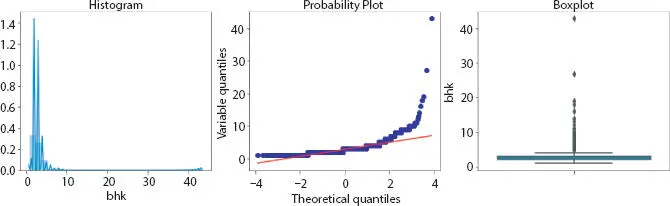
Figure 2.6BHK visualization.
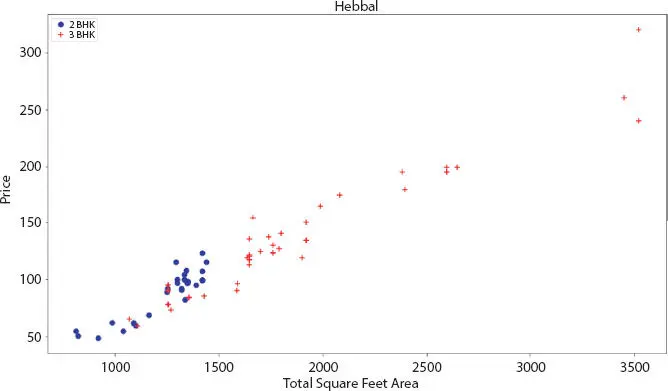
Figure 2.7Scatter plot for 2 and 3 BHK flat for total square feet.
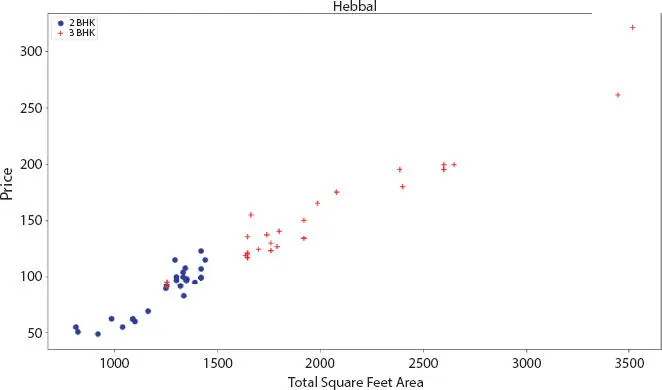
Figure 2.8 Scatter plot for 2 And 3 BHK flat for total square feet after removing outliers.
Читать дальшеИнтервал:
Закладка:
Похожие книги на «Advanced Analytics and Deep Learning Models»
Представляем Вашему вниманию похожие книги на «Advanced Analytics and Deep Learning Models» списком для выбора. Мы отобрали схожую по названию и смыслу литературу в надежде предоставить читателям больше вариантов отыскать новые, интересные, ещё непрочитанные произведения.


Обсуждение, отзывы о книге «Advanced Analytics and Deep Learning Models» и просто собственные мнения читателей. Оставьте ваши комментарии, напишите, что Вы думаете о произведении, его смысле или главных героях. Укажите что конкретно понравилось, а что нет, и почему Вы так считаете.