Stephen J. Mildenhall - Pricing Insurance Risk
Здесь есть возможность читать онлайн «Stephen J. Mildenhall - Pricing Insurance Risk» — ознакомительный отрывок электронной книги совершенно бесплатно, а после прочтения отрывка купить полную версию. В некоторых случаях можно слушать аудио, скачать через торрент в формате fb2 и присутствует краткое содержание. Жанр: unrecognised, на английском языке. Описание произведения, (предисловие) а так же отзывы посетителей доступны на портале библиотеки ЛибКат.
- Название:Pricing Insurance Risk
- Автор:
- Жанр:
- Год:неизвестен
- ISBN:нет данных
- Рейтинг книги:4 / 5. Голосов: 1
-
Избранное:Добавить в избранное
- Отзывы:
-
Ваша оценка:
Pricing Insurance Risk: краткое содержание, описание и аннотация
Предлагаем к чтению аннотацию, описание, краткое содержание или предисловие (зависит от того, что написал сам автор книги «Pricing Insurance Risk»). Если вы не нашли необходимую информацию о книге — напишите в комментариях, мы постараемся отыскать её.
A comprehensive framework for measuring, valuing, and managing risk Pricing Insurance Risk: Theory and Practice
Pricing Insurance Risk: Theory and Practice
Pricing Insurance Risk — читать онлайн ознакомительный отрывок
Ниже представлен текст книги, разбитый по страницам. Система сохранения места последней прочитанной страницы, позволяет с удобством читать онлайн бесплатно книгу «Pricing Insurance Risk», без необходимости каждый раз заново искать на чём Вы остановились. Поставьте закладку, и сможете в любой момент перейти на страницу, на которой закончили чтение.
Интервал:
Закладка:
The implicit representation defines a probability on the new outcome sample space by PX(A):=Pr(X∈A) for A⊂R. PX is uniquely determined by the distribution functionF(x):=Pr(X≤x).
When risk is solely a function of loss outcome, rather than the cause of loss, it can be appropriate to work with implicit events.
Example 9Ins Co. actuaries working with the homeowners line of business use the same catastrophe model as the commercial lines folks, but their spreadsheet has only the following columns:
Hurricane/earthquake flag
Homeowners portfolio loss
This information allows them to compute the probability distributions of losses, in total and also conditional on type of peril. However, it is insufficient to tie back to the commercial lines experience. The primary identifying feature for an event is the loss amount.
Example 10Ins Co. wants to purchase California earthquake reinsurance. The reinsurer needs explicit (event ID, event loss) model output, so it can aggregate its exposure. But Ins Co. can evaluate its reinsurance programs using implicit events (loss amount, probability).
3.4.3 Dual Implicit Representation
The implicit representation is a useful simplification. But there are situations where we can simplify it further. If we don’t care about the monetary outcome but care only about the rank of the outcomes, we can use the dual implicit representationand identify an outcome X = x with its nonexceedance probabilityp=F(x)=Pr(X≤x). Equivalently, we can relate x with s=S(x)=Pr(X>x), its exceedance probability.We work with the former and call it a dual implicit event.
Identifying an outcome with its probability is scale invariant and straightforward. It is easy to make comparisons: no matter the range of X , F ( X ) lies between 0 and 1. In fact, for continuous X , F ( X ) is uniformly distributed between 0 and 1—the basis of the inversion method for simulating random variables.
The dual implicit representation has the same disadvantage as the implicit: it is hard to aggregate. In addition, it suffers from being relative to an often unspecified reference portfolio. After Hurricane Katrina, news reports described it from a 25 year (relative to all US landfalling hurricanes) to a 400-year event (storms along a similar track).
Example 11Investors and rating agencies assess bonds by their estimated probability of default. They are using a dual implicit representation of the bond.
Example 12Although catastrophe models generally simulate explicit events, the results are often summarized by exceedance probability. Rating agency and regulatory capital models charge for catastrophe risk using events defined by exceedance probability, rather than objective event.
Example 13The homeowners reinsurance actuaries in Ins Co. get a spreadsheet similar to the commercial lines simulation output, with losses arranged in ascending order. Their concern is identifying where various proposed reinsurance programs attach and exhaust (Section 3.5.3). They flag various rows with notations such as program 1 attaches , program 2 exhausts , etc. Since the rows are in ascending loss order, they can count rows above or below a particular notation and calculate the probability of attachment and exhaustion. They prepare a report that focuses on these probabilities without mentioning the actual dollar loss amounts.
Remark 14The mapping from p back to x is defined by the inverse of the distribution function. Spreadsheet programs provide several, including: BETA.INV, CHISQ.INV, F.INV, GAMMA.INV, LOGNORM.INV, NORM.INV, and T.INV.
3.4.4 Dictionary between the Three Representations
All three representations are used in insurance. The explicit representation could be a specific claim file, as a claim adjuster sees it. Its implicit representation identifies it with its loss amount and ignores other details. And its dual implicit representation identifies it with its nonexceedance probability level. Many explicit events can have the same loss amount or probability level. The probability depends on the reference portfolio. Table 3.1summarizes the three ways of representing a risk. The last row shows how to compute expected values in each representation, the subject of the next section.
Table 3.1 Representing risks: event definitions and natural sample spaces
| Facet | Random variable | Distribution function | Quantile function |
|---|---|---|---|
| Notation | X | F | F −1 |
| Events | Explicit | Implicit | Dual implicit |
| Sample space | Ω | R=(−∞,∞) | [0,1]⊂R |
| Sample point | ω∈Ω | Outcome, x | Probability or rank, p |
| Probability | Pr | PX(a,b]=P(X∈(a,b])=F(b)−F(a) | Uniform |
| Mean E[X] | ∫ΩX(ω)Pr(dω) | ∫0∞(1−F(x))dx=∫0∞xdF(x) | ∫01F−1(p)dp |
Example 15Lloyd’s uses an explicit event approach to measure risk because of its intended use of the results. Each syndicate at Lloyd’s reports to the Corporation of Lloyd’s their estimated losses from 16 specific Realistic Disaster Scenarios (RDS), such as a Miami-Dade Florida Windstorm or Japanese Typhoon. The Corporation then aggregates them over all syndicates to determine its total exposure. If Lloyd’s merely asked each syndicate for its 100 year or 250 year loss, it would be unable to determine its aggregate exposure. Rating agencies and regulators evaluate companies on a standalone basis. They do not need to aggregate exposure in this way, and so a dual implicit event, such as a VaR or TVaR loss amount at an extreme return period, fits their intended purpose. The RDS system is described in Lloyd’s (2021). We discuss it further in Sections 5.1 and 5.A.
3.5 The Lee Diagram and Expected Losses
Graphical methods are widely used in mathematics and statistics to visually present ideas which would otherwise be abstruse.
Lee, The Mathematics of Excess of Loss Coverages (1988)
In this section, we present the Lee diagram and use it to illustrate different ways to compute expected and layer losses.
3.5.1 The Lee Diagram
Lee diagrams are introduced in Lee (1988), a famous actuarial science paper. Lee diagrams are a constructive visualization of several important actuarial concepts, and we use them extensively.
Figure 3.2 reproduces the original Lee diagram. It shows claims sorted by ascending size along the horizontal axis and outcome amount on the vertical axis.
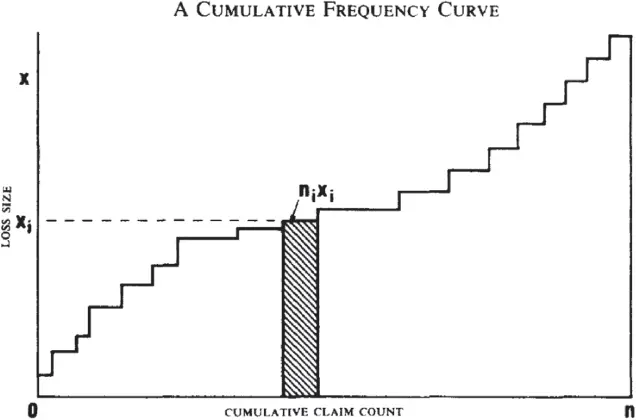
Figure 3.2 The original Lee diagram. Source: Lee (1988). Reproduced with permission of the Casualty Actuarial Society.
A Lee diagramplots outcome x on the vertical axis and probability of nonexceedance p=F(x) on the horizontal (label) axis. It is a plot of the dual implicit representation because it labels an event by F ( x ). The probability F ( x ) is equivalent to the event rank, between 0 (smallest) and 1 (largest). The Lee diagram can be obtained from the distribution function by reflecting its graph in a 45 degree line through the origin, or (more simply) from the survival function by rotating its graph by 90 degrees counterclockwise about the origin. After rotating, the horizontal axis shows the exceedance probability in reverse order, which is the same as the nonexceedance probability. Figure 3.3 panel (c) shows another Lee diagram.
Читать дальшеИнтервал:
Закладка:
Похожие книги на «Pricing Insurance Risk»
Представляем Вашему вниманию похожие книги на «Pricing Insurance Risk» списком для выбора. Мы отобрали схожую по названию и смыслу литературу в надежде предоставить читателям больше вариантов отыскать новые, интересные, ещё непрочитанные произведения.


Обсуждение, отзывы о книге «Pricing Insurance Risk» и просто собственные мнения читателей. Оставьте ваши комментарии, напишите, что Вы думаете о произведении, его смысле или главных героях. Укажите что конкретно понравилось, а что нет, и почему Вы так считаете.