Михаил Попов - Working Day Reduction as the Ground of Modern Economic Development
Здесь есть возможность читать онлайн «Михаил Попов - Working Day Reduction as the Ground of Modern Economic Development» весь текст электронной книги совершенно бесплатно (целиком полную версию без сокращений). В некоторых случаях можно слушать аудио, скачать через торрент в формате fb2 и присутствует краткое содержание. Год выпуска: 2021, Жанр: Политика, economics, на английском языке. Описание произведения, (предисловие) а так же отзывы посетителей доступны на портале библиотеки ЛибКат.
- Название:Working Day Reduction as the Ground of Modern Economic Development
- Автор:
- Жанр:
- Год:2021
- ISBN:нет данных
- Рейтинг книги:3 / 5. Голосов: 1
-
Избранное:Добавить в избранное
- Отзывы:
-
Ваша оценка:
Working Day Reduction as the Ground of Modern Economic Development: краткое содержание, описание и аннотация
Предлагаем к чтению аннотацию, описание, краткое содержание или предисловие (зависит от того, что написал сам автор книги «Working Day Reduction as the Ground of Modern Economic Development»). Если вы не нашли необходимую информацию о книге — напишите в комментариях, мы постараемся отыскать её.
This monograph is for students, post-graduates, scientists, officers of state and municipal authority, participants of trade union movement.
Working Day Reduction as the Ground of Modern Economic Development — читать онлайн бесплатно полную книгу (весь текст) целиком
Ниже представлен текст книги, разбитый по страницам. Система сохранения места последней прочитанной страницы, позволяет с удобством читать онлайн бесплатно книгу «Working Day Reduction as the Ground of Modern Economic Development», без необходимости каждый раз заново искать на чём Вы остановились. Поставьте закладку, и сможете в любой момент перейти на страницу, на которой закончили чтение.
Интервал:
Закладка:
The values of the free time rate during the period of seniority of services sphere employees are shown at table 47.
Table 47
The Free Time Rate during the Period of Seniority of Nonproduction Sphere Employees, Finished in 2012
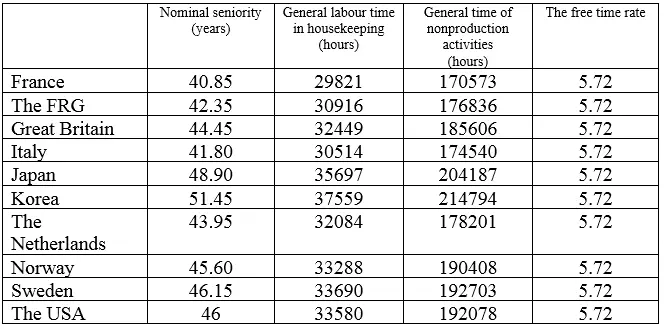
At the prerequisite of daily and annual equality of domestic labour expenditures equality of the free time rates within the whole seniority of employees of the spheres of the examined countries is natural. The level of the index showing many times superiority of nonproduction activities over labour in domestic production of this group of employees is significant here.
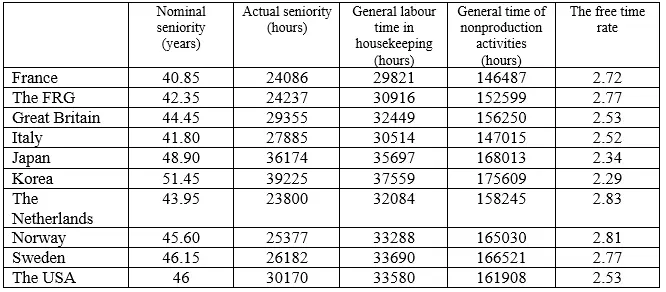
It is reasonable to compare the indices in the situation of conservation of old division of labour to the objectively possible free time rate in the situation of its overcoming.
In our research calculation of this index resembles the above calculation of the annual rate in the respect that the determinant part of the ratio of the working time fund in the production sphere and the similar fund in the services sphere will be taken into account (this ratio is taken as 35:65).
At the same time, because of absence of data on the general working time fund in production in statistics during 1970s-1980s, it is impossible to determine potential duration of working time per one able-bodied person, correlating the value of this part with the number of able-bodied people. We have to start from actual working time duration formation of which was influenced by reduction of employment. In this case the value of the sought index is quite approximate (table 48).
No doubt, with using saving of labour in the production sphere for reduction of working time of people occupied in it, all employees would mostly engage in nonproduction social activities during the period of their ability to work. Conditions for their development would be more favorable, as compared to industrial employees retired in 2012. The negative influence of excessively enduring labour in the services sphere, typical for its present employees, would not affect the state of the first ones.
All of it shows that the potential of modern economic development has not been adequately realized over the past decades. Old division of labour continues to be reproduced and slows progress of modern production forces down.
Table 48
The Free Time Rate Possible at Combination of Labour in Social Production and Rendering Services during the Period of Employees’ Seniority
Examination of the dynamics of duration of working activities periods separately must be supplemented with examination in their unity: only then the full picture of the present situation and tendencies of its changing will be got.
The Comparative Dynamics of Duration of Periods of Employees’ Working Activities
We started with studying the average annual number of working hours per one employee because this index is quite widely represented in the international statistics. Starting with this statistics we could approximately calculate duration of a working day and its dynamics.
Meanwhile, a working day is a starting and main element of the system of periods of labour activities. In the end, all following elements come to the sum of hours worked during a working day.
Obviously, the same total magnitude can reflect different combinations of elements depending on their duration. A 40-hour working week can consist of five 8-hour shifts or four 10-hour shifts. And, for example, duration of annual working time can be similar both at even monthly distribution of work and at its seasonal variations.
At the same value of the total magnitude of a composite working time period conditions for development of employees can differ depending on duration of elements of this sum. The key significance of working time duration lies in not just the fact that, in the end, it determines the value of working time of the rest of the periods of labour activities. The daily value of nonworking time, including free time, depends on working day duration.
Though, historically, working time reduction originally took place in the form of working day reduction mostly, but this is not the only one possible variant of utilization of saving of production labour. For example, within a year working time can reduce thanks to increasing in duration of weekends, holidays, and leaves at more or less constant duration of a working week.
The ratio of ways of working time reduction in modern industrially developed countries can be judged by the data of table 49. In this case, too, it is supposed that working time duration of industrial employees is similar to the average one in the economy.
Table 49
The Number of Annual Working Hours per One Person Occupied in the Economy, Working Week Duration in Manufacturing Industries, Duration of Leaves and Weekends in Several Industrially Developed Countries, Relative to Corresponding Indices of the FRG in 2007 (%)
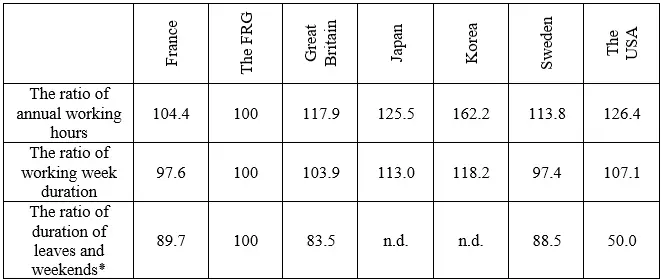
Calculated according to the data of the Organization for Economic Co-operation and Development, the International Labour Organization and also: Alesina A., Glaeser E. and Sacerdote B. Work and Leisure in the U.S. and Europe: Why so Different?// Discussion Paper Number 2068// April 2005, Harvard University, Cambridge, Massachusetts. P. 46. ٭The 2004 data.
As it follows from the above data, in 2007 in the FRG the number of annual working hours per one employee was minimal among the noted countries (1422 hours). Meanwhile, average working week duration in manufacturing industries of the FRG exceeded the corresponding indices of France and Sweden.
Pay attention to the fact that the relative excess of the annual number of hours per one employee of the countries, as compared to the index of the FRG, significantly exceeds the relative excess of working week duration in all the cases. It is explained by the more significant number of days of leaves and weekends in the FRG.
This situation formed for decades. Since 1983 till 2007 in the FRG annual working time per one employee reduced from 1809 hours to 1422 hours [38], i.e., by 22.4%, and a working week in manufacturing industries reduced from 40.5 hours to 38.5 hours [39], by 4.9% accordingly.
Consequently, in the FRG working time reduction was mostly used for increasing in duration of leaves and weekends for a quarter of a century.
Time released from production was distributed in the same way in France where annual working time reduced from 1785 hours to 1485 hours, by 17.8%, and a working week reduced from 38.9 hours to 37.6 hours, by 3.3% during 1983-2007.
And only in Korea, where annual working time reduced by 8.2% (from 2512 hours to 2306 hours), and a working week reduced by 7.7% (from 49.3 hours to 45.5 hours) since 2000 till 2007, saving of production labour was almost fully used for reduction of a working week. But this country is far from the countries leading in provision of free time to employees.
In several economically developed countries the tendency of convergence of tempos of reduction of annual working time and a working week has been outlined recently. For example, during 2000-2013 in France annual working time reduced by 4% (from 1534.8 hours to 1474.3 hours) and a working week reduced by 4.5% (from 38.8 hours to 36.1 hours), in the USA the reduction was by 2.6% and 2.8%, in Great Britain it was by 1.82% and 1.4%, in Germany it was by 6.2% and 7.3% accordingly.
Читать дальшеИнтервал:
Закладка:
Похожие книги на «Working Day Reduction as the Ground of Modern Economic Development»
Представляем Вашему вниманию похожие книги на «Working Day Reduction as the Ground of Modern Economic Development» списком для выбора. Мы отобрали схожую по названию и смыслу литературу в надежде предоставить читателям больше вариантов отыскать новые, интересные, ещё непрочитанные произведения.


Обсуждение, отзывы о книге «Working Day Reduction as the Ground of Modern Economic Development» и просто собственные мнения читателей. Оставьте ваши комментарии, напишите, что Вы думаете о произведении, его смысле или главных героях. Укажите что конкретно понравилось, а что нет, и почему Вы так считаете.