Михаил Попов - Working Day Reduction as the Ground of Modern Economic Development
Здесь есть возможность читать онлайн «Михаил Попов - Working Day Reduction as the Ground of Modern Economic Development» весь текст электронной книги совершенно бесплатно (целиком полную версию без сокращений). В некоторых случаях можно слушать аудио, скачать через торрент в формате fb2 и присутствует краткое содержание. Год выпуска: 2021, Жанр: Политика, economics, на английском языке. Описание произведения, (предисловие) а так же отзывы посетителей доступны на портале библиотеки ЛибКат.
- Название:Working Day Reduction as the Ground of Modern Economic Development
- Автор:
- Жанр:
- Год:2021
- ISBN:нет данных
- Рейтинг книги:3 / 5. Голосов: 1
-
Избранное:Добавить в избранное
- Отзывы:
-
Ваша оценка:
Working Day Reduction as the Ground of Modern Economic Development: краткое содержание, описание и аннотация
Предлагаем к чтению аннотацию, описание, краткое содержание или предисловие (зависит от того, что написал сам автор книги «Working Day Reduction as the Ground of Modern Economic Development»). Если вы не нашли необходимую информацию о книге — напишите в комментариях, мы постараемся отыскать её.
This monograph is for students, post-graduates, scientists, officers of state and municipal authority, participants of trade union movement.
Working Day Reduction as the Ground of Modern Economic Development — читать онлайн бесплатно полную книгу (весь текст) целиком
Ниже представлен текст книги, разбитый по страницам. Система сохранения места последней прочитанной страницы, позволяет с удобством читать онлайн бесплатно книгу «Working Day Reduction as the Ground of Modern Economic Development», без необходимости каждый раз заново искать на чём Вы остановились. Поставьте закладку, и сможете в любой момент перейти на страницу, на которой закончили чтение.
Интервал:
Закладка:
For a more obvious assessment of the way this potential is realized let us compare the daily free time rates of industrial employees, nonproduction sphere employees, and those who combine these kinds of activities (table 42).
As it follows from the shown data, the daily free time rate of employees combining labour in production and rendering services, even excluding the data on Korea, is many times – 6-10 times – higher than the similar index of industrial employees. Moreover, the gap among these indices tends to increasing owing to higher tempos of production labour reduction at employees combining these activities.
Table 42
The Daily Free Time Rate of Industrial Employees, Employees Combining Labour in Production with Rendering Services, and Nonproduction Sphere Employees
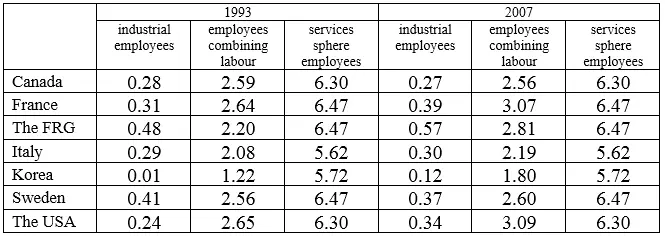
The free time rate of employees occupied in the nonproduction sphere substantially – 2-3 times – exceeds the index of employees in the conditions of overcoming social division of labour. However, it does not abolish significant predominance of nonproduction social activities at the latter. The highest value of the free time rate achieved owing to isolation from fulfilment of nonproduction work has its negative side. It supposes conservation of industrial employees’ low rate and fulfilling labour in the services sphere during time beyond satisfaction of the need for such labour and achievement of its high effectiveness.
Thus, in the modern economy the regularity of working time reduction and nonworking time increasing is seen what assists in employees’ development.
At the same time, the potential of modern economic development is not adequately realized what is the most strongly seen in conservation of an excessive working day and low tempos of its reduction. The present ratios between different kinds of social activities of members of the society – production labour, labour in the services sphere, and leisure – are contrary to free, all-round development of all members of the society – in defiance of objective prerequisites for this development. The gap between maturity of these prerequisites and the measure of their realization increases. Modern economic development requires overcoming it more and more strongly.
Working day duration influencing people’s health in many respects determines the value of the period of ability to work during a lifetime. It is necessary to examine this component of the system of periods of labour activities of employees.
2.3. Seniority Duration and its Dynamics
Nominal and Actual Seniority
When speaking about duration of seniority, the number of working years is meant most often. Meanwhile, as it follows from the previous analysis, the number of working hours per one employee significantly differs in different countries during the same year. Generally, in the modern economy the average annual volume of work regularly decreases at increasing in labour productivity what makes the prerequisite of equivalent labour expenditures during each year of employees’ working activities unreasonable, though this prerequisite, most often implicitly, is in most researches of employees’ “living profile”.
It is reasonable to tell nominal seniority – the number of years in economically active population – and actual seniority – measured by hours of labour during the whole period of economic activities of a member of the society. The data at table 43 show the significance of this differentiation.
When calculating the obtained data, the OECD’s statistics on the average annual number of actual working hours per one employee on average were used. In these statistics duration of working time of industrial and services sphere employees is not distinguished. In other words, within this analysis it is taken that the values of working time of different categories of employees are the same.
To find actual seniority we summarized the average annual number of working hours per one employee during the period of nominal seniority.
Table 43
Nominal and Actual Seniority of Employees Retired in 2012 in Economically Developed Countries
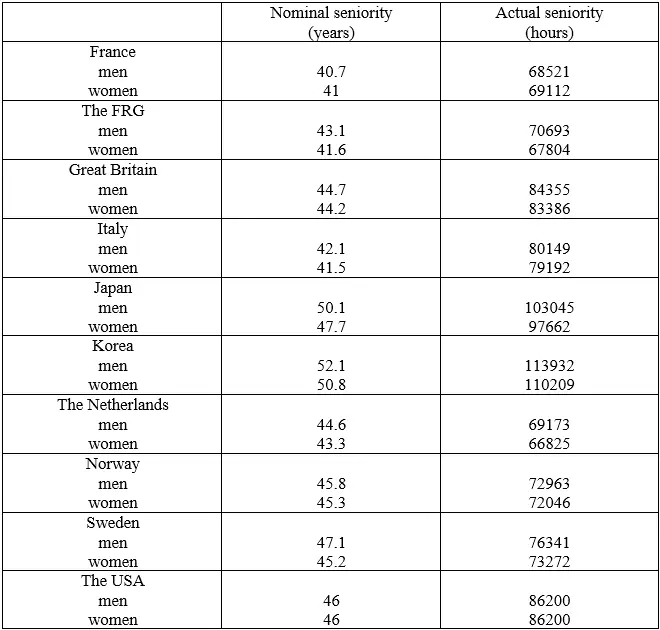
Source : calculated according to the data of the OECD
Obviously, these data do not fully correspond to the obtained data from the comparison of the general working time fund and employment, their correlation with the data analyzed in the previous paragraph is embarrassed by it.
As it is seen from the above data, the relative value of nominal seniority does not always correspond to the relative value of actual seniority. For example, in Italy the average number of years of working activities is less than in the other countries, except for France. At the same time, actual working time exceeds the similar index of most of the examined countries.
In Sweden nominal seniority is approximately similar to seniority of employees of the USA, but actual seniority is more than 10% less than it is in the USA.
In the Netherlands the shortest average (for men and women) actual seniority goes with relatively enduring nominal seniority.
Only in France, Japan, and Korea the value of actual seniority corresponds to the similar extreme value of nominal seniority.
Consequently, actual working time cannot be judged only by the number of years of formal ability to work. Meanwhile, actual working time is of decisive importance from the point of view of employees’ development. That is why in the following analysis the dynamics of actual seniority will be taken into consideration, first of all.
The Dynamics of the Average Number of Working Hours within Seniority
To determine the dynamics of actual seniority it is necessary to fix long-term tendencies in changing in the general volume of working time. These tendencies can be graphically shown by means of summarizing average annual values of working time within consecutive decades.
Table 44
The Volume of Working Time per One Employee in Economically Developed Countries (Hours)
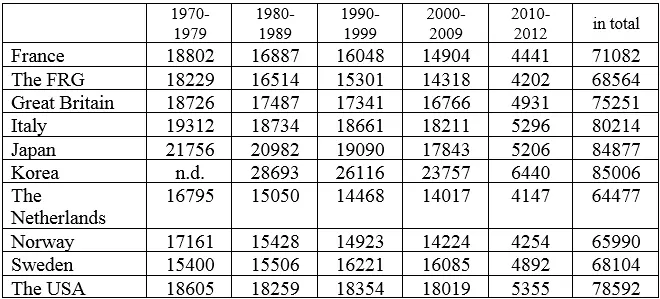
Source : calculated according to the data of the OECD
The above data show that in the economically developed countries decreasing in total annual working time duration per one employee from decade to decade is a dominating tendency. 1990s in the USA and 1980s-1990s in Sweden are exceptions.
The dynamics reflect not only reduction of working time of full-time employees but spreading of the practice of part-time work. However, as our calculations, according to the data on the FRG, show, within the analyzed decades full-time employees’ workload reduced at approximately similar rates as all employees’ workload on average. But its general value (71793 hours) was almost 5% more than the value shown at the table.
Examination of the dynamics of a working day, working year abstracts, as a rule, from the circumstance that it is about working activities of employees of different ages. When the dynamics of seniority is researched, then taking into account age differentiation is necessary because it is in the basis of comparison of working time values.
The studied period – 42 years – approximately coincides with nominal seniority of members of the society who became economically active in 1970. Every year within this period new younger employees joined economically active population, and older persons, who started working earlier 1970, left it.
Читать дальшеИнтервал:
Закладка:
Похожие книги на «Working Day Reduction as the Ground of Modern Economic Development»
Представляем Вашему вниманию похожие книги на «Working Day Reduction as the Ground of Modern Economic Development» списком для выбора. Мы отобрали схожую по названию и смыслу литературу в надежде предоставить читателям больше вариантов отыскать новые, интересные, ещё непрочитанные произведения.


Обсуждение, отзывы о книге «Working Day Reduction as the Ground of Modern Economic Development» и просто собственные мнения читателей. Оставьте ваши комментарии, напишите, что Вы думаете о произведении, его смысле или главных героях. Укажите что конкретно понравилось, а что нет, и почему Вы так считаете.