Doug Abbott - Embedded Linux development using Eclipse
Здесь есть возможность читать онлайн «Doug Abbott - Embedded Linux development using Eclipse» весь текст электронной книги совершенно бесплатно (целиком полную версию без сокращений). В некоторых случаях можно слушать аудио, скачать через торрент в формате fb2 и присутствует краткое содержание. Год выпуска: 2009, ISBN: 2009, Издательство: Elsevier, Жанр: Программирование, ОС и Сети, Программы, на английском языке. Описание произведения, (предисловие) а так же отзывы посетителей доступны на портале библиотеки ЛибКат.
- Название:Embedded Linux development using Eclipse
- Автор:
- Издательство:Elsevier
- Жанр:
- Год:2009
- ISBN:978-0-7506-8654-9
- Рейтинг книги:4 / 5. Голосов: 1
-
Избранное:Добавить в избранное
- Отзывы:
-
Ваша оценка:
Embedded Linux development using Eclipse: краткое содержание, описание и аннотация
Предлагаем к чтению аннотацию, описание, краткое содержание или предисловие (зависит от того, что написал сам автор книги «Embedded Linux development using Eclipse»). Если вы не нашли необходимую информацию о книге — напишите в комментариях, мы постараемся отыскать её.
• Overview of the latest C/C++ Development toolkit
• Includes case studies of eclipse use including Monta Vista, LynuxWorks, and WindRiver
Embedded Linux development using Eclipse — читать онлайн бесплатно полную книгу (весь текст) целиком
Ниже представлен текст книги, разбитый по страницам. Система сохранения места последней прочитанной страницы, позволяет с удобством читать онлайн бесплатно книгу «Embedded Linux development using Eclipse», без необходимости каждый раз заново искать на чём Вы остановились. Поставьте закладку, и сможете в любой момент перейти на страницу, на которой закончили чтение.
Интервал:
Закладка:
• Execution control: download, start, stop
• Breakpoints
• Examine and modify memory and registers
• Flash programming
• Hardware Diagnostics
Additionally, the ICE class products offer profile analysis and trace capabilities.
Wind River provides a number of sample programs to illustrate various features of Workbench. Under File→Newis an Example…menu item that can be used to create various sample projects. One class of examples is that of stand-alone projects that require no OS support (Figure 9.17). The C Demonstration program is a good starting point.
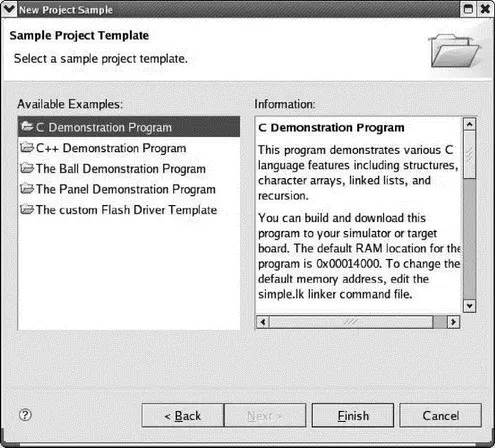
Figure 9.17: Sample project selection.
In place of an actual ICE or Probe device, the evaluation version provides an instruction set simulator for a PowerPC MPC8260 processor. You establish a connection to the instruction set simulator in the same way you would to any other type of remote system (see Figure 9.18).
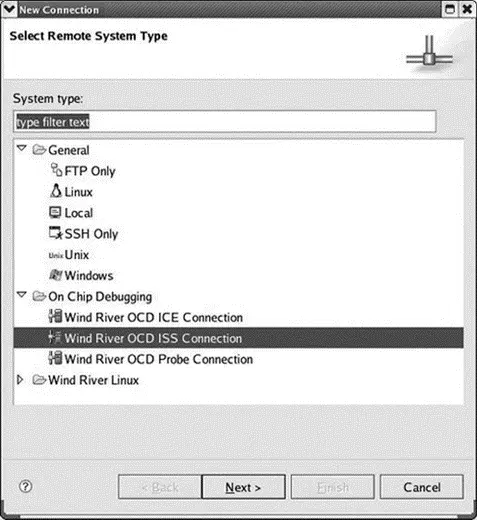
Figure 9.18: Remote system connection.
Next, you create a launch configuration for the project that uses the ISS connection. The dialog for setting up an OCD launch configuration is somewhat different from the launch configurations we’ve seen before (Figure 9.19). Perhaps not surprisingly, the dialog deals with a lot of hardware issues. The Download tab lets you specify the files that will be downloaded to the target.
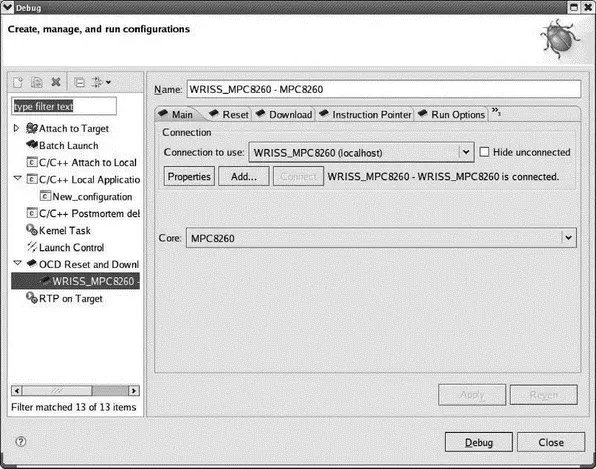
Figure 9.19: OCD launch configuration.
Clicking Debugbrings up the Device Debug perspective, which is similar to the standard Debug perspective, with some additional views (Figure 9.20). A System Context view appears in the editor window. This is a mixed C and assembly language listing of the code being executed. The Debug Symbol Browser shows all of the symbols in the project and supports operations such as going directly to the symbol’s declaration and setting a breakpoint at the symbol.
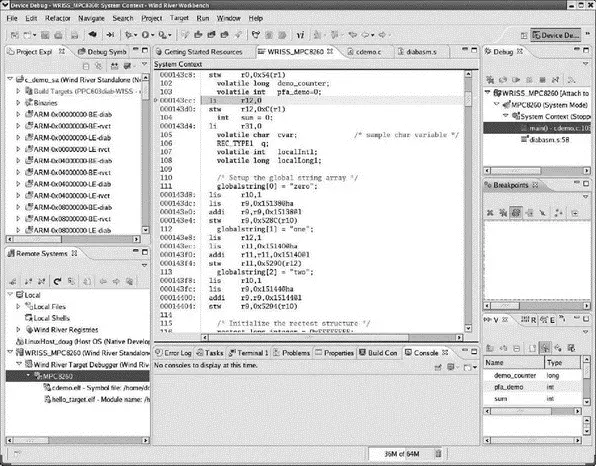
Figure 9.20: Device Debug perspective.
From this point on, debugging is essentially the same as we’ve seen earlier. Workbench OCD supports some additional views that are only meaningful if the debugging tool provides the necessary data. These include:
• Flash Programmer
• Hardware Diagnostics
• OCD Statistical Code Profiling
• Trace
9.4.4 Analysis Tools
The full Workbench product includes several analysis and visualization tools similar to what we’ve encountered with the other products reviewed in this chapter. They aren’t included with the Workbench OCD evaluation.
All but one of these tools (System Viewer) were previously offered as an add-on product called Scope Tools for Test and Validation. These are now included in the base Workbench platform. Each of these tools has its own Eclipse perspective with views appropriate to the task at hand.
This is the Wind River equivalent of the Linux Trace Toolkit. It was previously called WindView and has been around for quite some time [14] I remember playing with an early version with VxWorks back in the mid-1990s.
. Like LTT it provides a graphical visualization of system events to reveal the complex interactions of tasks, threads, and interrupts (Figure 9.21). I think of this kind of tool as a logic analyzer for the software.
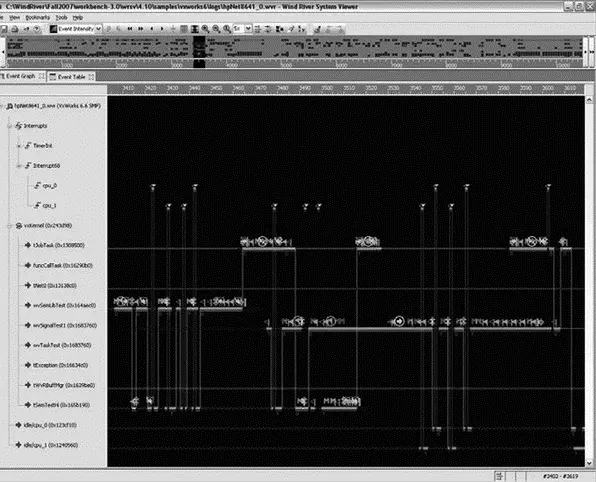
Figure 9.21: System Viewer.
You can scroll around the trace and zoom in on particular areas to see more detail. The set of processes, threads, and events being traced can be filtered to focus attention on specific areas of concern.
This is a dynamic performance profiler that shows where a program is spending its time. An agent on the target periodically takes a “snapshot” of the currently executing process and its call stack. These snapshots are saved in a buffer and periodically uploaded to the Profiler GUI on the host.
The Profiler graphically reports the percentage of CPU time spent in any function (Figure 9.22). This view organizes the information in a call stack format. Current Direct % is the time spent in the function itself. Current Indirect % is the time spent in the function and all functions that it calls. Click on a function name in the Performance Profiler, and an editor opens at that function.
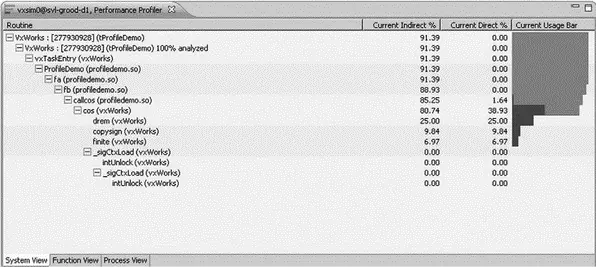
Figure 9.22: Performance Profiler.
This tool serves as a memory leak detector much like MontaVista’s implementation of mpatrol. On the target it dynamically patches the memory allocation functions with instrumentation code. This approach means the application doesn’t have to be rebuilt for memory analysis and also means you can analyze any code, not just your own.
Like the Performance Profiler, the data is collected in a local buffer and periodically uploaded to the Memory Analyzer GUI on the host.
The Data Monitor uses an oscilloscope metaphor to monitor program variables in real time and display the results graphically (Figure 9.23). Like the Performance Profiler, an agent on the target periodically samples the variables being monitored and stores the values in a local buffer. A low priority process then sends this buffer to the host for display. The performance hit is claimed to be fairly minor.
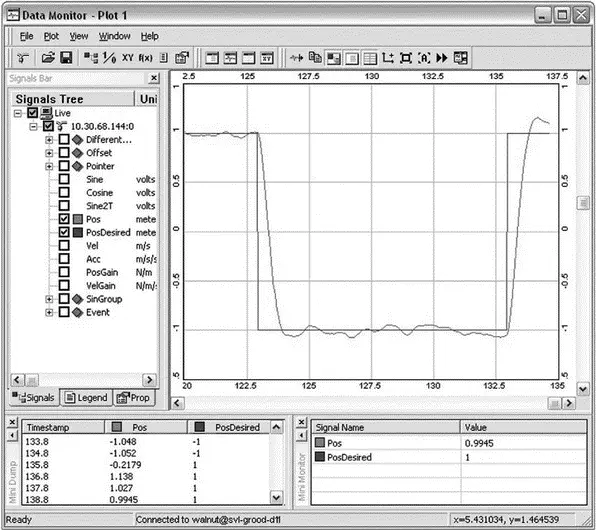
Figure 9.23: Data Monitor.
The sampling interval is configurable. Variables can be added or removed from the monitor list while the application runs. Variable values can also be modified at run time. Collected data can be stored to a file on the host, formatted for post processing by other applications, such as MatLab or Excel.
As described thus far, the Data Monitor is asynchronous with respect to any running applications. In some situations, it may be more meaningful to collect data synchronously. The Data Monitor target agent can be configured to collect data in response to calls from the application, thus making data collection synchronous with respect to the application.
This tool reports how much of the code in a system has been executed, or more importantly, which code hasn’t been executed. Unlike the other tools, Code Coverage requires that the code be recompiled with the appropriate instrumentation added. You select which files to instrument and the level of coverage analysis. The four types of coverage are:
• Function: Verifies that the function was called.
• Block: Did this statement or block of statements get executed?
• Decision: Have both the true and false branches of a Boolean expression used in a branching statement such as if() or while() been executed?
Читать дальшеИнтервал:
Закладка:
Похожие книги на «Embedded Linux development using Eclipse»
Представляем Вашему вниманию похожие книги на «Embedded Linux development using Eclipse» списком для выбора. Мы отобрали схожую по названию и смыслу литературу в надежде предоставить читателям больше вариантов отыскать новые, интересные, ещё непрочитанные произведения.


Обсуждение, отзывы о книге «Embedded Linux development using Eclipse» и просто собственные мнения читателей. Оставьте ваши комментарии, напишите, что Вы думаете о произведении, его смысле или главных героях. Укажите что конкретно понравилось, а что нет, и почему Вы так считаете.