Doug Abbott - Embedded Linux development using Eclipse
Здесь есть возможность читать онлайн «Doug Abbott - Embedded Linux development using Eclipse» весь текст электронной книги совершенно бесплатно (целиком полную версию без сокращений). В некоторых случаях можно слушать аудио, скачать через торрент в формате fb2 и присутствует краткое содержание. Год выпуска: 2009, ISBN: 2009, Издательство: Elsevier, Жанр: Программирование, ОС и Сети, Программы, на английском языке. Описание произведения, (предисловие) а так же отзывы посетителей доступны на портале библиотеки ЛибКат.
- Название:Embedded Linux development using Eclipse
- Автор:
- Издательство:Elsevier
- Жанр:
- Год:2009
- ISBN:978-0-7506-8654-9
- Рейтинг книги:4 / 5. Голосов: 1
-
Избранное:Добавить в избранное
- Отзывы:
-
Ваша оценка:
Embedded Linux development using Eclipse: краткое содержание, описание и аннотация
Предлагаем к чтению аннотацию, описание, краткое содержание или предисловие (зависит от того, что написал сам автор книги «Embedded Linux development using Eclipse»). Если вы не нашли необходимую информацию о книге — напишите в комментариях, мы постараемся отыскать её.
• Overview of the latest C/C++ Development toolkit
• Includes case studies of eclipse use including Monta Vista, LynuxWorks, and WindRiver
Embedded Linux development using Eclipse — читать онлайн бесплатно полную книгу (весь текст) целиком
Ниже представлен текст книги, разбитый по страницам. Система сохранения места последней прочитанной страницы, позволяет с удобством читать онлайн бесплатно книгу «Embedded Linux development using Eclipse», без необходимости каждый раз заново искать на чём Вы остановились. Поставьте закладку, и сможете в любой момент перейти на страницу, на которой закончили чтение.
Интервал:
Закладка:
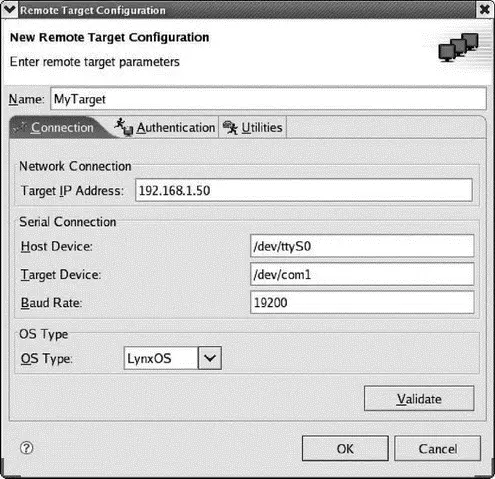
Figure 9.5: Remote Target Configuration.
The Authentication tab lets you enter a user name and password, and a directory on the target where application binaries will be downloaded. The Utilities tab sets network protocol parameters and can usually be left at default values. If you only define one target, it becomes the default.
Luminosity defines its own launch configuration for LynuxWorks C/C++ projects. The only tab that differs from the standard C/C++ Local Application launch configuration is the Debugger tab (Figure 9.6). This sets parameters for remote debugging on the default target.
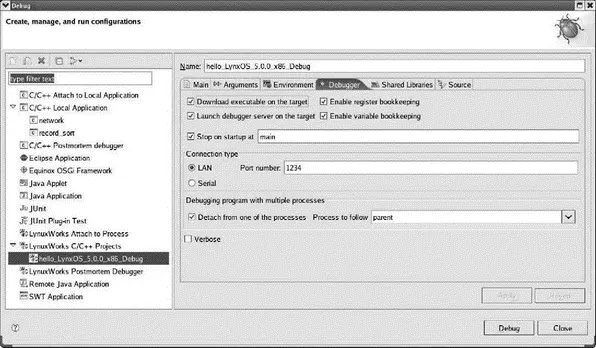
Figure 9.6: Launch configuration debugger tab.
Basic debugging is essentially the same as in standard Eclipse. LynuxWorks does add a couple of its own interesting debug features.
There are times when you don’t really want to, or can’t, stop the program at the breakpoint, but you would like to monitor its behavior by watching the value of selected variables. Tracepoints are set in the program in much the same way as are breakpoints. When program execution encounters a tracepoint, any variables or expressions attached to it are evaluated and saved. Later, when the program is stopped, you can review the saved data.
Two new views are associated with tracepoints: Tracepoints and Trace Data. The Tracepoints view is where you define and configure tracepoints. Figure 9.7 shows the Tracepoint properties dialog where you can add expressions to be monitored.
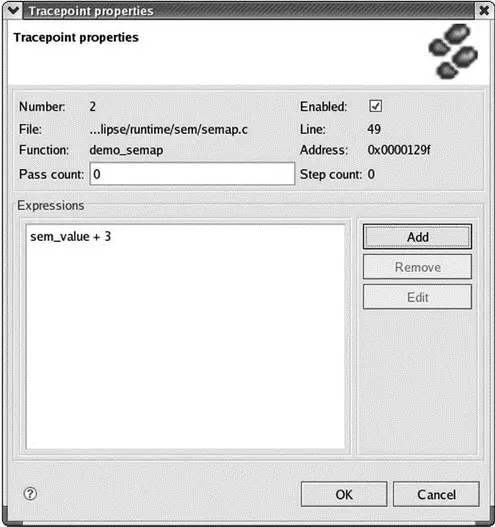
Figure 9.7: Tracepoint properties.
The Trace Data view displays collected trace data when the program is stopped. It provides menu items to start and stop tracing, scroll through the collected data, and save the data to a file.
Luminosity can display information about POSIX inter-process communication mechanisms being used by the application being debugged. This information is contained in a set of views representing each of the IPC mechanisms:
• Semaphores
• Mutexes
• Conditional variables
• Message queues
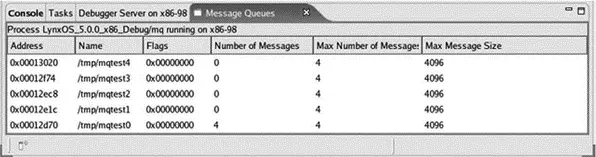
Figure 9.8: Message Queues view.
9.3 MontaVista — DevRocket
MontaVista offers both an Application Development Kit (ADK) and a Platform Development Kit (PDK). The latter is intended for doing Linux kernel development and building board support packages (BSPs). The former is intended for application development and leaves out the features that support kernel and BSP development. Both packages are based on the company’s DevRocket IDE, which in turn is built on Eclipse.
9.3.1 Getting the Evaluation
For purposes of this book, I tested an on-line demo of DevRocket that includes a simulation of a Power PC target board. MontaVista’s website includes an “Evaluation Center,” accessed from the Products and Services tab of the main page. From there you can fill out a form to request access to the online demo. You should then receive an email with a link to the demo, a user ID, and a password. Access is time-limited. In my case it was about two weeks.
ADK version 5.0 includes:
• Eclipse version 3.2
• CDT version 3.1
• Remote System Explorer 1.0
• GNU cross tool chain for a specific architecture, based on GCC 4.2
• Analysis and optimization tools:
○ Application pre-linking
○ Library optimization
○ Memory leak detection
○ Memory usage analysis
○ Application profiling
○ Linux Trace Toolkit: in PDK only
• Linux kernel version 2.6.18
• “Virtual target” based on VMware for testing without actual target hardware
9.3.2 Getting Started
After obtaining a user ID and password from MontaVista, you are directed to a specific web page from where you can start the simulation. This brings up a Gnome graphical desktop, as shown in Figure 9.9.
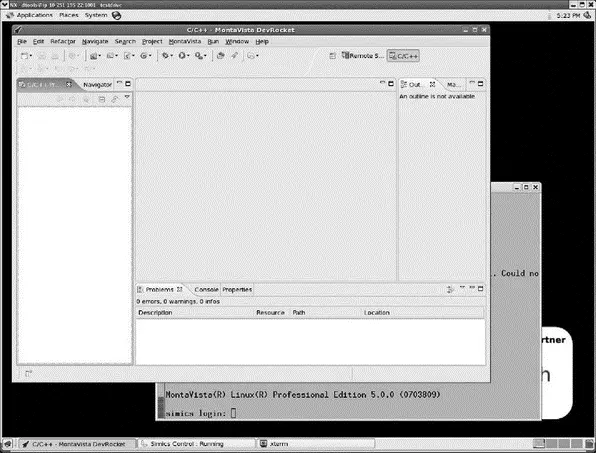
Figure 9.9: DevRocket simulation.
The desktop initially has three windows open: DevRocket itself, an Xterm serial console connected to the simulated target board, and the target simulation. The first thing to notice is a new top-level menu item, MontaVista, the contents of which are shown in Figure 9.10.
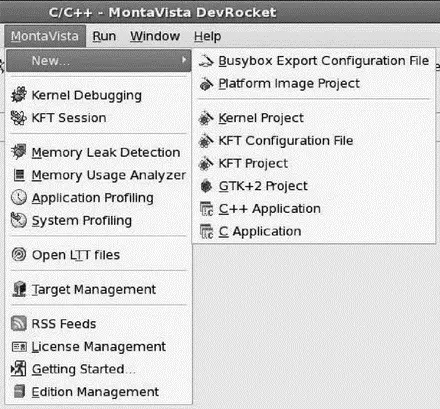
Figure 9.10: MontaVista menu.
This menu provides access to most of MontaVista’s extensions. Note the range of new objects that can be created. The memory analysis and profiling tools can be started from here. There are facilities for license and edition management that bring up corresponding preferences pages. The RSS Feedsitem brings up a Feeds view where you can see RSS feeds from your favorite news sites.
This version includes the Platform Development features so the menu includes a number of kernel development items. The Kernel Projectlets you configure and build a Linux kernel and subsequently debug it using KGDB.
KFT stands for Kernel Function Trace, which is effectively a profiling tool for the kernel. It adds instrumentation callouts to every kernel function entry and exit to generate a trace log of function execution with timing details. This adds considerable overhead to the kernel, so it’s not particularly good for revealing precise timing problems such as race conditions, but it is useful for identifying bottlenecks such as functions with long execution times and those that are called frequently.
9.3.3 Platform Image Builder (PIB)
One of the tasks required for an embedded Linux device is to create a file system. What goes in it, what can you leave out? Creating a file system by hand can be a tedious, iterative process as you work through the various feature dependencies.
Platform Image Builder is a combination of a project creation wizard and a perspective to help guide you through the process of building a file system from RPM packages.
You can also add your own applications and libraries from projects in your workspace by importing the files into the Image Builder project.
The Platform Image perspective, Figure 9.11, includes a Platform Image Builder editor that lists the packages available for inclusion in the file system. Here you select the pre-defined packages you need and the wizard works out the dependencies from the RPM database as you select them. The editor includes filtering and grouping options to make it easier to navigate through the package list.
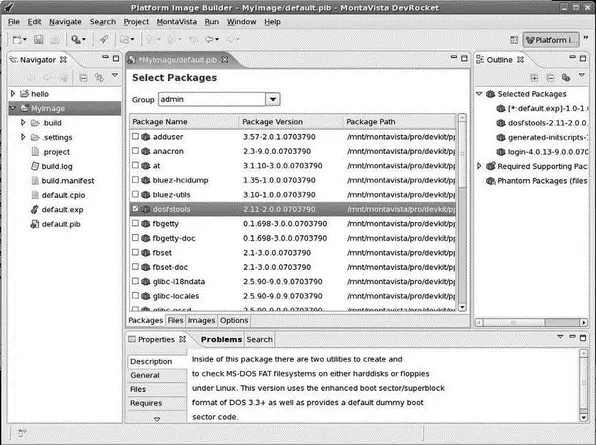
Figure 9.11: Platform Image Builder perspective.
When you highlight a package in the Packagestab, details about the package such as version, release information, and dependencies show up in the Properties view. This information comes directly from the RPM database. Other tabs in the editor include Files, which details the structure of the file system, and Images, which lets you specify one or more mount points on the target. Each mount point gets its own image. The Optionstab lists optional features of the build. The output of the Platform Image Builder editor is a file called default.pib.
Интервал:
Закладка:
Похожие книги на «Embedded Linux development using Eclipse»
Представляем Вашему вниманию похожие книги на «Embedded Linux development using Eclipse» списком для выбора. Мы отобрали схожую по названию и смыслу литературу в надежде предоставить читателям больше вариантов отыскать новые, интересные, ещё непрочитанные произведения.


Обсуждение, отзывы о книге «Embedded Linux development using Eclipse» и просто собственные мнения читателей. Оставьте ваши комментарии, напишите, что Вы думаете о произведении, его смысле или главных героях. Укажите что конкретно понравилось, а что нет, и почему Вы так считаете.