Doug Abbott - Embedded Linux development using Eclipse
Здесь есть возможность читать онлайн «Doug Abbott - Embedded Linux development using Eclipse» весь текст электронной книги совершенно бесплатно (целиком полную версию без сокращений). В некоторых случаях можно слушать аудио, скачать через торрент в формате fb2 и присутствует краткое содержание. Год выпуска: 2009, ISBN: 2009, Издательство: Elsevier, Жанр: Программирование, ОС и Сети, Программы, на английском языке. Описание произведения, (предисловие) а так же отзывы посетителей доступны на портале библиотеки ЛибКат.
- Название:Embedded Linux development using Eclipse
- Автор:
- Издательство:Elsevier
- Жанр:
- Год:2009
- ISBN:978-0-7506-8654-9
- Рейтинг книги:4 / 5. Голосов: 1
-
Избранное:Добавить в избранное
- Отзывы:
-
Ваша оценка:
Embedded Linux development using Eclipse: краткое содержание, описание и аннотация
Предлагаем к чтению аннотацию, описание, краткое содержание или предисловие (зависит от того, что написал сам автор книги «Embedded Linux development using Eclipse»). Если вы не нашли необходимую информацию о книге — напишите в комментариях, мы постараемся отыскать её.
• Overview of the latest C/C++ Development toolkit
• Includes case studies of eclipse use including Monta Vista, LynuxWorks, and WindRiver
Embedded Linux development using Eclipse — читать онлайн бесплатно полную книгу (весь текст) целиком
Ниже представлен текст книги, разбитый по страницам. Система сохранения места последней прочитанной страницы, позволяет с удобством читать онлайн бесплатно книгу «Embedded Linux development using Eclipse», без необходимости каждый раз заново искать на чём Вы остановились. Поставьте закладку, и сможете в любой момент перейти на страницу, на которой закончили чтение.
Интервал:
Закладка:
There’s another file in the project called default.exp, which stands for “exports.” The name strikes me as a little odd because what it really does is identify directories, files, and symbolic links to be added to the file system. This file is managed by an Exports editor .
The Outline view shows the packages that have been selected as well as the required supporting packages.
The final output of an Image Builder project is a binary image of the file system called default.where represents the type of file system you’re building, such as ext2or ext3, jffs2, and so on. The file system type is specified in the Images tab of the Platform Image Builder editor.
9.3.4 Memory Analysis Tools
DevRocket includes two memory analysis tools: a memory leak detector and a usage analyzer. The leak detector is based on mpatrol, an open source library that wraps malloc()and free()functions, and the C++ new()operator, with instrumentation that logs each call to these functions. mpatrol is a dynamically-linked shared library, so there’s no change to the application.
DevRocket wraps the text-based mpatrol library and utilities with a graphical Eclipse front end to make it easier to work with. To run a program with memory leak detection, you create a Memory Leak Detection run configuration from the MontaVistamenu. This is much like any other run or debug launch configuration, with the addition of a tab for configuring mpatrol (Figure 9.12). The defaults seem to be just fine.
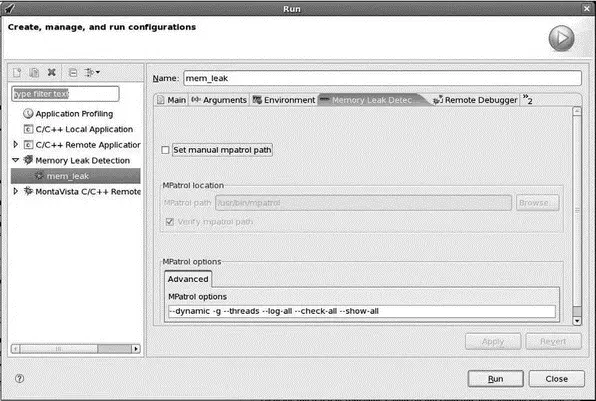
Figure 9.12: Memory leak detection launch configuration.
When you click Run, DevRocket invokes mpatrol to run the program and then brings up the Memory Leak Detection perspective, with views that display the contents of the mpatrol logs. Figure 9.13 shows a Call Graph in the Memory Leak Detection view.
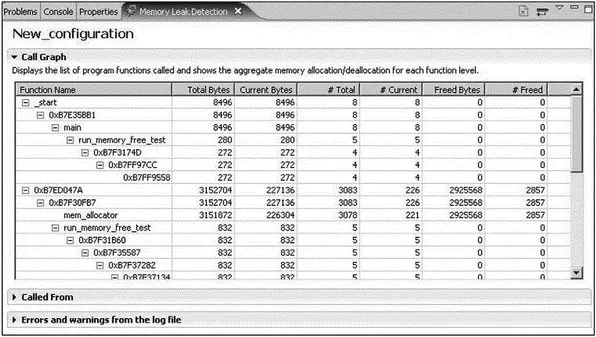
Figure 9.13: Memory Leak Detection view.
The memory analysis tool is intended to help you find memory usage problems quickly and accurately by providing a graphical depiction of memory usage across the entire system. Memory analysis starts with a high-level view showing relative memory usage for the whole system. From there you can drill down into kernel and applicationspecific memory usage. Drilling down even further, you can view a memory map for each application.
From the menu bar, select MontaVista→Memory Usage Analyzer. This brings up the Memory Usage Analyzer view, shown in Figure 9.14. From here you can click on Applications or Kernel to get more detail. Figure 9.15 shows memory usage by user space applications. The kernel usage graph shows memory allocated by vmalloc(), allocated as slabs, and memory used by page tables.
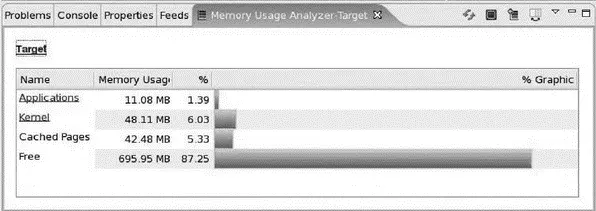
Figure 9.14: Memory Usage Analyzer view, system level.
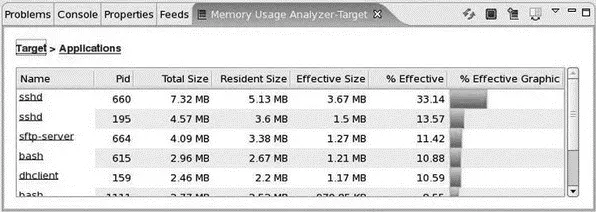
Figure 9.15: Memory Usage Analyzer view, applications.
The information for the Memory Usage Analyzer comes from /procfiles. There are a number of virtual files in the /procdirectory and in the subdirectories for each process that provide information on memory usage. The Memory Usage Analyzer simply collates this information in a convenient, easy-to-understand format.
9.4 Wind River — Workbench
Wind River’s entry in the Eclipse IDE sweepstakes is called, simply, Workbench. The current version is 3.0, based on Eclipse version 3.3.1. Workbench supports both Linux and Wind River’s proprietary operating system, VxWorks. In addition to the standard GNU compiler, Wind River also supplies its own compiler with support for multiple target architectures. In addition to supporting both VxWorks and Linux code development, the Wind River compiler also supports stand-alone applications. It also has a number of simulators so you don’t need a target for debugging.
9.4.1 Getting the Evaluation
I downloaded an evaluation version that supports on-chip debugging. Workbench for On-Chip Debugging (OCD) uses in-circuit emulation (ICE) to target tasks such as board bring-up and flash programming, where a software debugger such as GDB may not yet be operational. While the full Workbench OCD product supports debugging Linux and VxWorks projects, the evaluation version is limited to stand-alone projects.
From the Productstab on Wind River’s web site, select Download Center. Then select Software. Listed among the top three evaluations is Workbench 3.0 for On-Chip Debugging. Click that link, then click Download, and you’re given the choice of downloading or getting a CD. Clicking Downloadhere takes you to an information form to fill out. After completing the form you’ll be able to download the 600 MB file.
Wind River uses the FlexLM license manager. The evaluation comes with a 30-day license.
9.4.2 Getting Started
When you start this version of Workbench, after getting past the workspace selection and Welcome screen, you’re presented with a start dialog that offers choices such as creating or editing a launch configuration, connecting, or syncing with a target. The main editor window shows a list of Getting Started Resources (Figure 9.16) with links to documentation and other support resources. Workbench supports an RSS Feeds view that is already subscribed to several Wind River feeds. Roll the cursor over an item in the Feeds view and a pop-up appears, displaying a summary of that item.
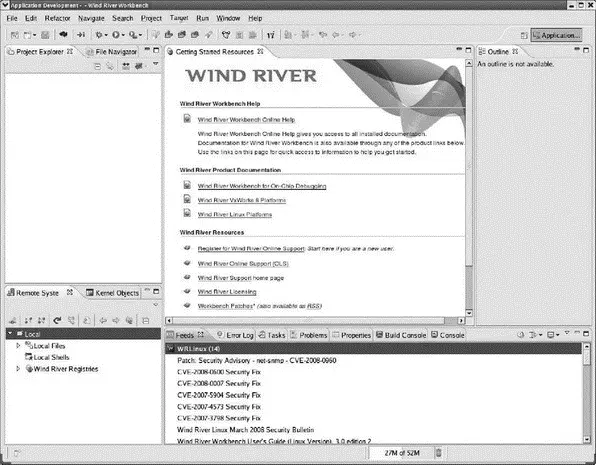
Figure 9.16: Workbench initial screen.
The default perspective is called Application Development. It’s similar to the C/C++ perspective with the addition of several views, including:
• Remote Systems
• File Navigator
• Kernel Objects
• Feeds
• Build Console
Workbench makes a distinction between consoles that are attached to targets and the local console that displays the build results. The latter is called the Build Console.
There are some additional items in the tool bar. There’s a feature to make the editor emulate vi. Another feature turns on Emacs key bindings, replacing some of the standard Eclipse key bindings.
9.4.3 On-Chip Debugging
The objective of the OCD version of Workbench is to provide tools that help in the early stages of a project, such as bringing up a new board. At this point there’s no operating system, so OCD supports a stand-alone application environment where the executable image is expected to be self-contained. We also can’t expect the hardware itself to be working, so usually a hardware debugging device such as a JTAG probe or an in-circuit emulator (ICE) is called for.
Accordingly, Workbench OCD provides Remote System connections for two classes of hardware debugging products, Wind River ICE and Wind River Probe. Both products use either JTAG or BDM ports to connect to a target board. Probe connects to the host through USB, while ICE connects via Ethernet and an RS-232 port. Both devices support typical debugging features, such as:
Читать дальшеИнтервал:
Закладка:
Похожие книги на «Embedded Linux development using Eclipse»
Представляем Вашему вниманию похожие книги на «Embedded Linux development using Eclipse» списком для выбора. Мы отобрали схожую по названию и смыслу литературу в надежде предоставить читателям больше вариантов отыскать новые, интересные, ещё непрочитанные произведения.


Обсуждение, отзывы о книге «Embedded Linux development using Eclipse» и просто собственные мнения читателей. Оставьте ваши комментарии, напишите, что Вы думаете о произведении, его смысле или главных героях. Укажите что конкретно понравилось, а что нет, и почему Вы так считаете.