Mark Murphy - Beginning Android
Здесь есть возможность читать онлайн «Mark Murphy - Beginning Android» весь текст электронной книги совершенно бесплатно (целиком полную версию без сокращений). В некоторых случаях можно слушать аудио, скачать через торрент в формате fb2 и присутствует краткое содержание. Город: New York, Год выпуска: 2009, ISBN: 2009, Издательство: Apress, Жанр: Программирование, на английском языке. Описание произведения, (предисловие) а так же отзывы посетителей доступны на портале библиотеки ЛибКат.
- Название:Beginning Android
- Автор:
- Издательство:Apress
- Жанр:
- Год:2009
- Город:New York
- ISBN:978-1-4302-2420-4
- Рейтинг книги:3 / 5. Голосов: 1
-
Избранное:Добавить в избранное
- Отзывы:
-
Ваша оценка:
Beginning Android: краткое содержание, описание и аннотация
Предлагаем к чтению аннотацию, описание, краткое содержание или предисловие (зависит от того, что написал сам автор книги «Beginning Android»). Если вы не нашли необходимую информацию о книге — напишите в комментариях, мы постараемся отыскать её.
Dear Reader,
First, welcome to the world of Android! We’re entering a new era of mobile application development, one marked by open platforms and open source, to take ‘walled gardens’ and make them green houses for any and all to participate in. Android is relatively easy for developers, and I believe that this innovation will help generate a large ecosystem of developers and consumers within a very short time. This means that budding developers such as yourself will have many opportunities to design and build your own applications and you’ll have a huge and hungry customer base.
Second, welcome to the book! Its purpose is to start you on your way with building Android applications, and to help you master the learning curve. Android is already a rich framework, comparable in many ways to the richness Android of desktop Java environments. This means that there is a lot of cool stuff for you to pick up along your journey in order to create the slickest, most useful apps Android you can imagine.
The source code for the code samples in this book is all available from the Apress site, so you can stay as hands-on and practical as you like while I introduce you to the core of Android, and invite you to experiment with the various classes and APIs we’ll be looking at. By the time you’ve finished this book, you’ll be creating your own Android applications and asking yourself what your next great application will be…!
Enjoy! Mark Murphy
Beginning Android — читать онлайн бесплатно полную книгу (весь текст) целиком
Ниже представлен текст книги, разбитый по страницам. Система сохранения места последней прочитанной страницы, позволяет с удобством читать онлайн бесплатно книгу «Beginning Android», без необходимости каждый раз заново искать на чём Вы остановились. Поставьте закладку, и сможете в любой момент перейти на страницу, на которой закончили чтение.
Интервал:
Закладка:
The main area of the Layout View shows a tree of the various Views that make up your activity, starting from the overall system window and driving down into the individual UI widgets that users are supposed to interact with. You will see, on the lower-right branch of the tree, the LinearLayout, Button, and EditTextshown in the previous code listing. The remaining Viewsare all supplied by the system, including the title bar.
Clicking on one of the views adds more information to this perspective and can be seen in Figure 37-5.
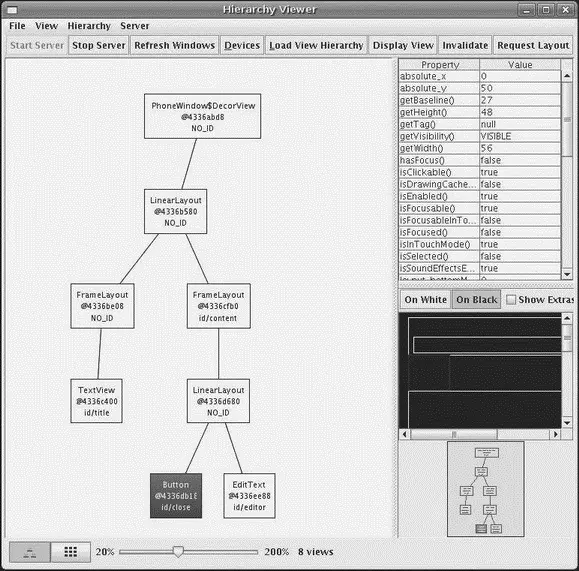
Figure 37-5. Hierarchy Viewer View properties
Now, in the upper-right region of the viewer, we see properties of the selected widget — in this case, theButton. Alas, these properties do not appear to be editable.
Also, the widget is highlighted in red in the wireframe of the activity, shown beneath the properties (by default, views are shown as white outlines on a black background). This can help you ensure you have selected the right widget, if, say, you have several buttons and cannot readily tell from the tree what is what.
If you double-click on a Viewin the tree, you are given a pop-up pane showing just that View(and its children), isolated from the rest of your activity.
Down in the lower-left corner, you will see two toggle buttons, with the tree button initially selected. Clicking on the grid button puts the viewer in a whole new perspective, called the Pixel Perfect View (see Figure 37-6).
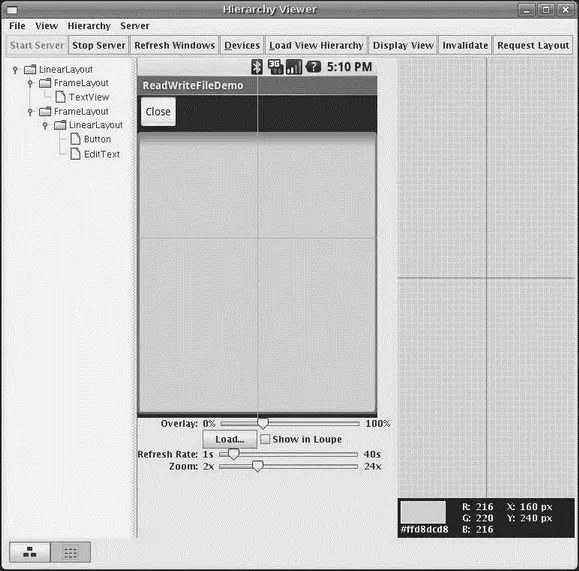
Figure 37-6. Hierarchy Viewer Pixel Perfect View
On the left, you see a tree representing the widgets and other Viewsin your activity. In the middle, you see your activity (the Normal View), and on the right, you see a zoomed edition of your activity (the Loupe View).
What may not be initially obvious is that this imagery is live. Your activity is polled every so often, controlled by the Refresh Rate slider. Anything you do in the activity will then be reflected in the Pixel Perfect View’s Normal and Loupe Views.
The hairlines (cyan) overlaying the activity show the position being zoomed upon — just click on a new area to change where the Loupe View is inspecting. Of course, there is another slider to adjust how much the Loupe View is zoomed.
Delightful Dalvik Debugging Detailed, Demoed
Another tool in the Android developer’s arsenal is the Dalvik Debug Monitor Service (DDMS). This is a “Swiss Army knife,” allowing you to do everything from browse log files, update the GPS location provided by emulator, simulate incoming calls and messages, and browse the onemulator storage to push and pull files.
DDMS has a wide range of uses, so this section will not try to cover them all, rather it will cover the most useful at the time of writing.
To launch DDMS, run the ddmsprogram inside the tools/directory in your Android SDK distribution. It will initially display just a tree of emulators and running programs on the left (see Figure 37-7).
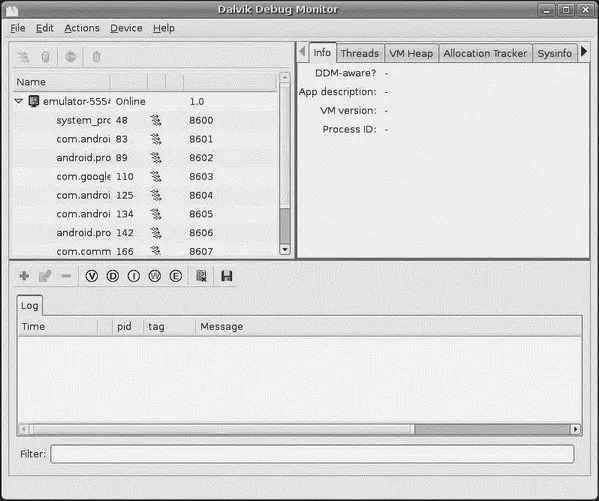
Figure 37-7. DDMS initial view
Clicking on an emulator allows you to browse the event log on the bottom and manipulate the emulator via the tabs on the right as shown in Figure 37-8.
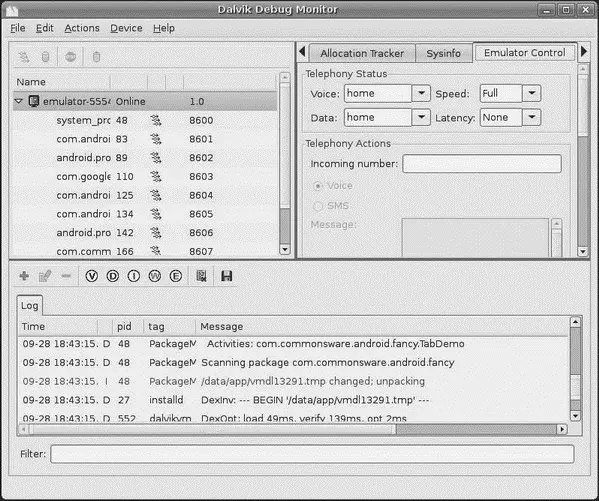
Figure 37-8. DDMS, with emulator selected
Logging
Rather than use adb logcat, DDMS lets you view your logging information in a scrollable table. Just highlight the emulator or device you want to monitor, and the bottom half of the screen shows the logs (see Figure 37-9).
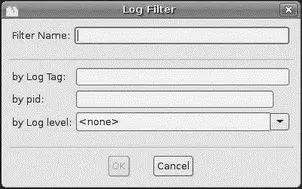
Figure 37-9. DDMS logging filter
In addition, you can:
• Filter the Log tab by any of the five logging levels, shown as the V through E toolbar buttons.
• Create a custom filter, so you can view only those tagged with your application’s tag, by pressing the + toolbar button and completing the form. The name you enter in the form will be used as the name of another logging output tab in the bottom portion of the DDMS main window.
• Save the log information to a text file for later perusal, or for searching.
File Push and Pull
While you can use adb pulland adb pushto get files to and from an emulator or device, DDMS lets you do that visually. Just highlight the emulator or device you wish to work with, then choose Device→File Explorer…from the main menu. That will bring up the typical directory browser seen in Figure 37-10.
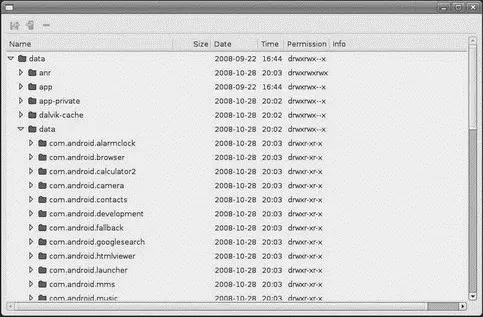
Figure 37-10. DDMS File Explorer
Just browse to the file you want and click either the pull (left-most) or push (middle) toolbar button to transfer the file to/from your development machine. Or, click the delete (right-most) toolbar button to delete the file.
There are a few caveats to this:
• You cannot create directories through this tool. You will either need to use adb shellor create them from within your application.
• While you can putter through most of the files on an emulator, you can access very little outside of /sdcardon an actual device, due to Android security restrictions.
Screenshots
To take a screenshot of the Android emulator or device, simply press - or choose Device→Screen capture…from the main menu. This will bring up a dialog box containing an image of the current screen shown in Figure 37-11.
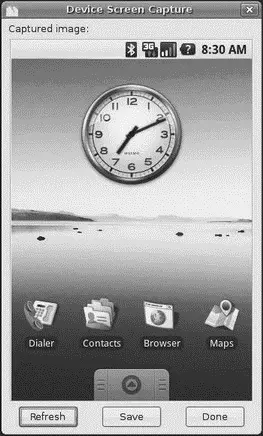
Figure 37-11. DDMS screen capture
From here, you can click Saveto save the image as a PNG file somewhere on your development machine, Refreshto update the image based on the current state of the emulator or device, or Doneto close the dialog.
Location Updates
To use DDMS to supply location updates to your application, the first thing you must do is have your application use the gps LocationProvider, as that is the one that DDMS is set to update.
Then, click on the Emulator Control tab and scroll down to the Location Controls section. Here, you will find a smaller tabbed pane with three options for specifying locations: Manual, GPX, and KML (see Figure 37-12).
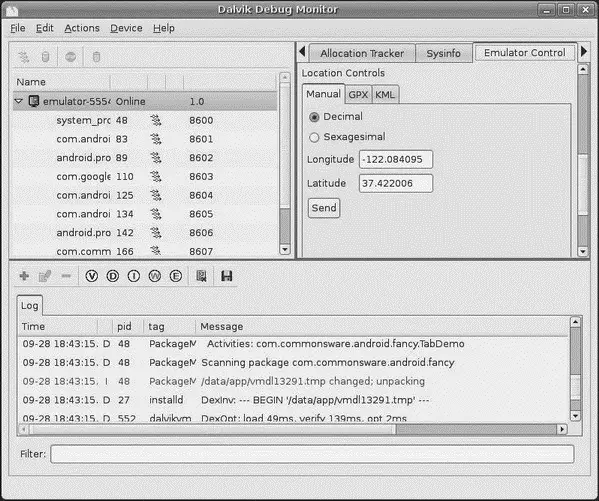
Figure 37-12. DDMS location controls
Читать дальшеИнтервал:
Закладка:
Похожие книги на «Beginning Android»
Представляем Вашему вниманию похожие книги на «Beginning Android» списком для выбора. Мы отобрали схожую по названию и смыслу литературу в надежде предоставить читателям больше вариантов отыскать новые, интересные, ещё непрочитанные произведения.


Обсуждение, отзывы о книге «Beginning Android» и просто собственные мнения читателей. Оставьте ваши комментарии, напишите, что Вы думаете о произведении, его смысле или главных героях. Укажите что конкретно понравилось, а что нет, и почему Вы так считаете.