Crispin, Lisa - Agile Testing - A Practical Guide for Testers and Agile Teams
Здесь есть возможность читать онлайн «Crispin, Lisa - Agile Testing - A Practical Guide for Testers and Agile Teams» весь текст электронной книги совершенно бесплатно (целиком полную версию без сокращений). В некоторых случаях можно слушать аудио, скачать через торрент в формате fb2 и присутствует краткое содержание. Год выпуска: 2008, Издательство: Addison-Wesley Professional, Жанр: Старинная литература, на английском языке. Описание произведения, (предисловие) а так же отзывы посетителей доступны на портале библиотеки ЛибКат.

- Название:Agile Testing: A Practical Guide for Testers and Agile Teams
- Автор:
- Издательство:Addison-Wesley Professional
- Жанр:
- Год:2008
- ISBN:нет данных
- Рейтинг книги:4 / 5. Голосов: 1
-
Избранное:Добавить в избранное
- Отзывы:
-
Ваша оценка:
Agile Testing: A Practical Guide for Testers and Agile Teams: краткое содержание, описание и аннотация
Предлагаем к чтению аннотацию, описание, краткое содержание или предисловие (зависит от того, что написал сам автор книги «Agile Testing: A Practical Guide for Testers and Agile Teams»). Если вы не нашли необходимую информацию о книге — напишите в комментариях, мы постараемся отыскать её.
Agile Testing: A Practical Guide for Testers and Agile Teams — читать онлайн бесплатно полную книгу (весь текст) целиком
Ниже представлен текст книги, разбитый по страницам. Система сохранения места последней прочитанной страницы, позволяет с удобством читать онлайн бесплатно книгу «Agile Testing: A Practical Guide for Testers and Agile Teams», без необходимости каждый раз заново искать на чём Вы остановились. Поставьте закладку, и сможете в любой момент перейти на страницу, на которой закончили чтение.
Интервал:
Закладка:
See the bibliography for links to sites where you can research tools.
Use these tools to look for performance bottlenecks. Lisa’s team uses JProfiler to look for application bottlenecks and memory leaks, and JConsole to analyze database usage. Similar tools exist for .NET and other environments, including .NET Memory Profiler and ANTS Profiler Pro. As Grig points out, there are database-specific profilers to pinpoint performance issues at the database level; ask your database experts to work with you. Your system administrators can help you use shell commands such as top, or tools such as PerfMon to monitor CPU, memory, swap, disk I/O, and other hardware resources. Similar tools are available at the network level, for example, NetScout.
You can also use the tools the team is most familiar with. In one project, Janet worked very closely with one of the programmers to create the tests. She helped him to define the tests needed based on customer’s performance and load expectations, and he automated them using JUnit. Together they analyzed the results to report back to the customer.
Establishing a baseline is a good first step for evaluating performance. The next section explores this aspect of performance testing.
Baseline
Performance tuning can turn into a big project, so it is essential to provide a baseline that you can compare against new versions of the software on performance. Even if performance isn’t your biggest concern at the moment, don’t ignore it. It’s a good idea to get a performance baseline so that you know later which direction your response time is headed. Lisa’s company hosts a website that has had a small load on it. They got a load test baseline on the site so that as it grew, they’d know how performance was being affected.
Performance Baseline Test Results
Lisa’s coworker Mike Busse took on the task of obtaining performance baselines for their web application that manages retirement plans. He evaluated load test tools, implemented one (JMeter), and set about to get a baseline. He reported the results both in a high-level summary and a spreadsheet with detailed results.
The tests simulated slowly increasing the load up to 100 concurrent users. Three test scripts, each for a common user activity, were used, and they were run separately and all together. Data gathered included:
• Maximum time of a transaction
• Maximum number of busy connections.
• A plot of the max time of a transaction against the number of users (see Figure 11-2 for an example of a chart)
Figure 11-2 Max and average transaction times at different user loads.
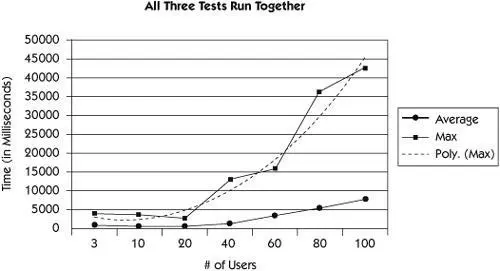
• Number of users who were on the system when the max time of a transaction equaled eight seconds
An important aspect of reporting results was providing definitions of terms such as transaction and connection in order to make the results meaningful to everyone. For example, maximum time of a transaction is defined as the longest transaction of all transactions completed during the test.
Mike’s report also included assumptions made for the performance test:
• Eight seconds is a transaction threshold that we would not like to cross.
• The test web server is equivalent to either of the two web servers in production.
• The load the system can handle, as determined by these tests, can be doubled in production because the load is distributed between two web servers.
• The distribution of tasks in the test that combines all three tests is accurate to a reasonable degree.
Mike also identified shortcomings with the performance baseline. More than one transaction can contribute to loading a page, meaning that the max page load time could be longer than the max time of a transaction. The test machine doesn’t duplicate the production environment, which has two machines and load-balancing software to distribute the transactions.
The report ended with a conclusion about the number of concurrent users that the production system could support. This serves as a guideline to be aware of as the production load increases. The current load is less than half of this number, but there are unknowns, such as whether the production users are all active or have neglected to log out.
Make sure your performance tests adequately mimic production conditions. Make results meaningful by defining each test and metric, explaining how the results correlate to the production environment and what can be done with the results, and providing results in graphical form.
If there are specific performance criteria that have been defined for specific functionality, we suggest that performance testing be done as part of the iteration to ensure that issues are found before it is too late to fix them.
Benchmarking can be done at any time during a release. If new functionality is added that might affect the performance, such as complicated queries, rerun the tests to make sure there are no adverse effects. This way, you have time to optimize the query or code early in the cycle when the development team is still familiar with the feature.
Any performance, load, or stress test won’t be meaningful unless it’s run in an environment that mimics the production environment. Let’s talk more about environments.
Test Environments
Final runs of the performance tests will help customers make decisions about accepting their product. For accurate results, tests need to be run on equipment that is similar to that of production. Often teams will use smaller machines and extrapolate the results to decide if the performance is sufficient for the business needs. This should be clearly noted when reporting test results.
Stressing the application to see what load it can take before it crashes can also be done anytime during the release, but usually it is not considered high-priority by customers unless you have a mission-critical system with lots of load.
One resource that is affected by increasing load is memory. In the next section, we discuss memory management.
Memory Management
Memory is usually described in terms of the amount (normally the minimum or maximum) of memory to be used for RAM, ROM, hard drives, and so on. You should be aware of memory usage and watch for leaks, because they can cause catastrophic failures when the application is in production during peak usage. Some programming languages are more susceptible to memory issues, so understanding the strengths and weaknesses of the code will assist you in knowing what to watch for. Testing for memory issues can be done as part of performance, load, and stress testing.
Garbage collection is one tool used to release memory back to the program. However, it can mask severe memory issues. If you see the available memory steadily decreasing with usage and then all of a sudden increasing to maximum available, you might suspect the garbage collection has kicked in. Watch for anomalies in the pattern or whether the system starts to get slow under heavy usage. You may need to monitor for a while and work with the programmers to find the issue. The fix might be something simple, such as scheduling the garbage collection more often or setting the trigger level higher.
When you are working with the programmers on a story, ask them if they expect problems with memory. You can test specifically if you know there might be a risk in the area. Watching for memory leaks is not always easy, but there are tools to help. This is an area where programmers should have tools easily available. Collaborate with them to verify that the application is free of memory issues. Perform the performance and load tests described in the previous section to verify that there aren’t any memory problems.
Читать дальшеИнтервал:
Закладка:
Похожие книги на «Agile Testing: A Practical Guide for Testers and Agile Teams»
Представляем Вашему вниманию похожие книги на «Agile Testing: A Practical Guide for Testers and Agile Teams» списком для выбора. Мы отобрали схожую по названию и смыслу литературу в надежде предоставить читателям больше вариантов отыскать новые, интересные, ещё непрочитанные произведения.


Обсуждение, отзывы о книге «Agile Testing: A Practical Guide for Testers and Agile Teams» и просто собственные мнения читателей. Оставьте ваши комментарии, напишите, что Вы думаете о произведении, его смысле или главных героях. Укажите что конкретно понравилось, а что нет, и почему Вы так считаете.