Crispin, Lisa - Agile Testing - A Practical Guide for Testers and Agile Teams
Здесь есть возможность читать онлайн «Crispin, Lisa - Agile Testing - A Practical Guide for Testers and Agile Teams» весь текст электронной книги совершенно бесплатно (целиком полную версию без сокращений). В некоторых случаях можно слушать аудио, скачать через торрент в формате fb2 и присутствует краткое содержание. Год выпуска: 2008, Издательство: Addison-Wesley Professional, Жанр: Старинная литература, на английском языке. Описание произведения, (предисловие) а так же отзывы посетителей доступны на портале библиотеки ЛибКат.

- Название:Agile Testing: A Practical Guide for Testers and Agile Teams
- Автор:
- Издательство:Addison-Wesley Professional
- Жанр:
- Год:2008
- ISBN:нет данных
- Рейтинг книги:4 / 5. Голосов: 1
-
Избранное:Добавить в избранное
- Отзывы:
-
Ваша оценка:
Agile Testing: A Practical Guide for Testers and Agile Teams: краткое содержание, описание и аннотация
Предлагаем к чтению аннотацию, описание, краткое содержание или предисловие (зависит от того, что написал сам автор книги «Agile Testing: A Practical Guide for Testers and Agile Teams»). Если вы не нашли необходимую информацию о книге — напишите в комментариях, мы постараемся отыскать её.
Agile Testing: A Practical Guide for Testers and Agile Teams — читать онлайн бесплатно полную книгу (весь текст) целиком
Ниже представлен текст книги, разбитый по страницам. Система сохранения места последней прочитанной страницы, позволяет с удобством читать онлайн бесплатно книгу «Agile Testing: A Practical Guide for Testers and Agile Teams», без необходимости каждый раз заново искать на чём Вы остановились. Поставьте закладку, и сможете в любой момент перейти на страницу, на которой закончили чтение.
Интервал:
Закладка:
These types of measurements can be reported simply and still be effective.
Lisa’s Story
My team emails a color-coded calendar out every day showing whether the “full build” with the full suite of regression tests passed each day (see Figure 15-10). Two “red” days in a row (the darkest color) are a cause for concern and noticed by management as well as the development team. Seeing the visual test results helps the organization pull together to fix the failing tests or any other problems causing the build to not run, such as hardware or database issues.
—Lisa
Figure 15-10 Full build result email from Lisa’s team

There are different ways to measure the number of tests. Choose one and try to stay consistent across the board with all types of tests, otherwise your metrics may get confusing. Measuring the number of test scripts or classes is one way, but each one may contain multiple individual test cases or “asserts,” so it may be more accurate to count those.
If you’re going to count tests, be sure to report the information so that it can be used. Build emails or build status UIs can communicate the number of tests run, passed, and failed at various levels. The customer team may be content to see this information only at the end of each sprint, in the sprint review, or an email.
Whatever metrics you choose to gather, be sure the team buys into them.
Janet’s Story
I started a new contract with a team that had been doing agile for a couple of years, and they had developed a large number of automated functional tests. I started keeping track of the number of tests passing each day. The team didn’t see a problem when the trending showed fewer and fewer tests were passing. The unit tests were maintained and were doing what they were supposed to do, so the team felt confident in the release. It seemed this happened with every release, and the team would spend the last week before the release to make all of the tests pass. It was costly to maintain the tests, but the team didn’t want to slow down to fix them. Everyone was okay with this except me.
I did not see how fixing the tests at that late date could ensure the right expected results were captured. I felt that we ran the risk of getting false positives.
At the start of the next release cycle, I got the team to agree to try fixing the tests as they broke. It didn’t take long for the team to realize that it wasn’t so tough to fix the tests as soon as we knew they were broken, and we found a lot of issues early that hadn’t usually been caught until much later. The team soon set a goal of having 95% of the tests passing at all times.
We also realized how brittle the tests were. The team made a concerted effort to refactor some of the more complex tests and eliminate redundant ones. Over time, the number of high-level tests was reduced, but the quality and coverage was increased.
We started out measuring passing rates, but we ended up with far more.
—Janet
Don’t get so caught up in the actual measurements that you don’t recognize other side effects of the trending. Be open to adjusting what you are measuring if the need is there.
Code Coverage
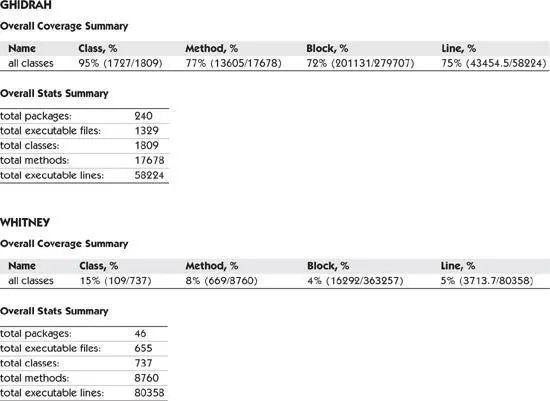
Code coverage is another traditional metric. How much of our code is exercised by our tests? There are excellent commercial and open source code coverage tools available, and these can be integrated into your build process so that you know right away if coverage has gone up or down. As with most metrics, the trend is the thing to watch. Figure 15-11 shows a sample code coverage report.
Table 15-11. Sample code coverage report from Lisa’s team. “Ghidrah” is the new architecture; “Whitney” is the legacy system.
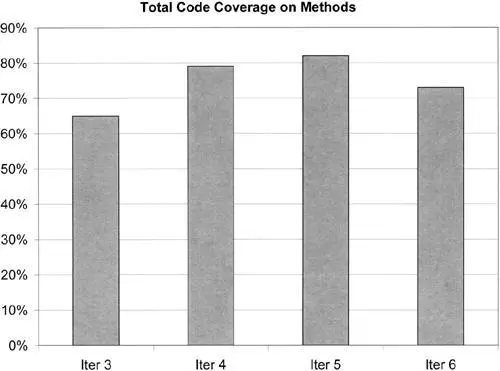
Figures 15-12 and 15-13 are two examples of trends that work together. Figure 15-12 shows a trend of the total number of methods each iteration. Figure 15-12 is the matching code coverage. These examples show why graphs need to be looked at in context. If you only look at the first graph showing the number of methods, you’ll only get half the story. The number of methods is increasing, which looks good, but the coverage is actually decreasing. We do not know the reason for the decreased coverage, but it should be a trigger to ask the team, “Why?”
Figure 15-12 Number of methods trend
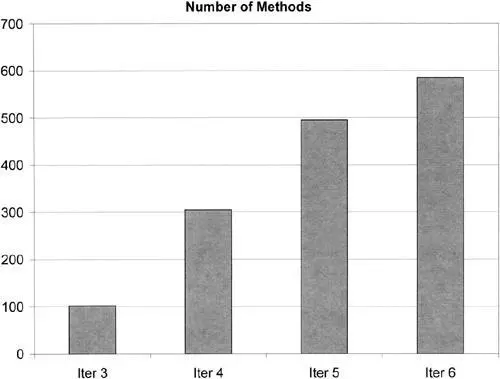
Figure 15-13 Test coverage
Remember that these tools can only measure coverage of the code you’ve written. If some functionality was missed, your code coverage report will not bring that to light. You might have 80% code coverage with your tests, but you’re missing 10% of the code you should have. Driving development with tests helps avoid this problem, but don’t value code coverage statistics more than they deserve.
Know What You Are Measuring
Alessandro Collino, a computer science and information engineer with Onion S.p.A. who works on agile projects, told us about an experience where code coverage fell suddenly and disastrously. His agile team developed middleware for a real-time operating system on an embedded system. He explained:
A TDD approach was followed to develop a great number of good unit tests oriented to achieve good code coverage. We wrote many effective acceptance tests to check all of the complex functionalities. After that, we instrumented the code with a code coverage tool and reached a statement coverage of 95%.
The code that couldn’t be tested was verified by inspection, leading them to declare 100% of statement coverage after ten four-week sprints.
After that, the customer required to us to add a small feature before we delivered the software product. We implemented this request and applied the code optimization of the compiler.
This time, when we ran the acceptance tests, the result was disastrous; 47% of acceptance tests failed, and the statement coverage had fallen down to 62%!
What happened? The problem turned out to be due to enabling compiler optimization but with an incorrect setting. Because of this, a key value was read once as the application started up and was stored in a CPU register. Even when the variable was modified in memory, the value in the CPU register was never replaced. The routine kept reading this same stale value instead of the correct updated value, causing tests to fail.
Alessandro concludes, “The lesson learned from this example is that the enabling of the compiler optimization options should be planned at the beginning of the project. It’s a mistake to activate them at the final stages of the project.”
Good metrics require some good planning. Extra effort can give you more meaningful data. Pierre Veragen’s team members use a break-test baseline technique to learn if their code coverage metric is meaningful. They manually introduce a flaw into each method and then run their tests to make sure the tests catch the problem. Some tests just make sure the code returns some value, any value. Pierre’s team makes sure the tests return the correct value. In this way, they can determine whether their test coverage is good enough.
Читать дальшеИнтервал:
Закладка:
Похожие книги на «Agile Testing: A Practical Guide for Testers and Agile Teams»
Представляем Вашему вниманию похожие книги на «Agile Testing: A Practical Guide for Testers and Agile Teams» списком для выбора. Мы отобрали схожую по названию и смыслу литературу в надежде предоставить читателям больше вариантов отыскать новые, интересные, ещё непрочитанные произведения.


Обсуждение, отзывы о книге «Agile Testing: A Practical Guide for Testers and Agile Teams» и просто собственные мнения читателей. Оставьте ваши комментарии, напишите, что Вы думаете о произведении, его смысле или главных героях. Укажите что конкретно понравилось, а что нет, и почему Вы так считаете.