Crispin, Lisa - Agile Testing - A Practical Guide for Testers and Agile Teams
Здесь есть возможность читать онлайн «Crispin, Lisa - Agile Testing - A Practical Guide for Testers and Agile Teams» весь текст электронной книги совершенно бесплатно (целиком полную версию без сокращений). В некоторых случаях можно слушать аудио, скачать через торрент в формате fb2 и присутствует краткое содержание. Год выпуска: 2008, Издательство: Addison-Wesley Professional, Жанр: Старинная литература, на английском языке. Описание произведения, (предисловие) а так же отзывы посетителей доступны на портале библиотеки ЛибКат.

- Название:Agile Testing: A Practical Guide for Testers and Agile Teams
- Автор:
- Издательство:Addison-Wesley Professional
- Жанр:
- Год:2008
- ISBN:нет данных
- Рейтинг книги:4 / 5. Голосов: 1
-
Избранное:Добавить в избранное
- Отзывы:
-
Ваша оценка:
Agile Testing: A Practical Guide for Testers and Agile Teams: краткое содержание, описание и аннотация
Предлагаем к чтению аннотацию, описание, краткое содержание или предисловие (зависит от того, что написал сам автор книги «Agile Testing: A Practical Guide for Testers and Agile Teams»). Если вы не нашли необходимую информацию о книге — напишите в комментариях, мы постараемся отыскать её.
Agile Testing: A Practical Guide for Testers and Agile Teams — читать онлайн бесплатно полную книгу (весь текст) целиком
Ниже представлен текст книги, разбитый по страницам. Система сохранения места последней прочитанной страницы, позволяет с удобством читать онлайн бесплатно книгу «Agile Testing: A Practical Guide for Testers and Agile Teams», без необходимости каждый раз заново искать на чём Вы остановились. Поставьте закладку, и сможете в любой момент перейти на страницу, на которой закончили чтение.
Интервал:
Закладка:
Janet’s Story
I started with team members who had been doing agile for a few months with only a couple of programmers and one tester. They had been using XPlanner to track their tasks and stories, and it was working ok for them. At the same time I came on board, a couple of new programmers were added, and the stand-ups became less effective; the team was not completing the stories it had planned. I suggested a storyboard, and although they were skeptical about keeping two sets of “tasks,” they said they would try it.
We took an open wall and used stickies to create our story board. We started having stand-ups in front of the story board and our discussion became more specific. It provided a nice visible way of knowing when the tasks were done and what was left to do. After a couple of months, the team grew again and we had to move the story board into an office. We also moved our stand-ups and our test result charts there. However, the constant visibility was lost, and programmers and testers stopped moving their tasks.
We had to reevaluate what we wanted to do. One size does not fit all teams. Make sure you plan for what is right for your team.
—Janet
Some teams use different colored index cards for the different types of tasks: green for testing, white for coding, yellow and red for bugs. Other teams use one card per development task, and add different colored stickers to show that testing is in progress or show that there are bugs to resolve. Use any method that lets you see at a quick glance how many stories are “done,” with all coding, database, testing, and other tasks completed. As the iteration progresses, it’s easy to see if the team is on track, or if you need to pull a story out or have programmers pitch in on testing tasks.
Janet’s Story
Our story board (shown in Figure 15-8) wasn’t very big, and we didn’t have a lot of wall space to expand to have the regular column-type task board. Instead, we decided to use stickers to designate the status.
Figure 15-8 Example story board
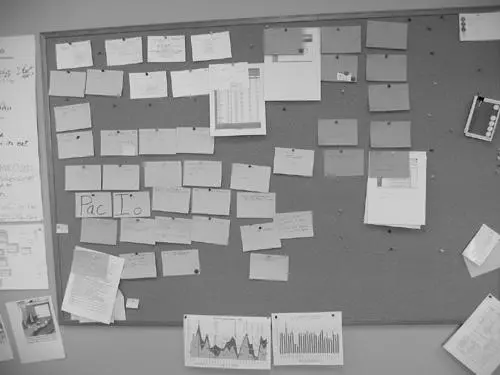
White cards, such as those shown in the first row of Figure 15-8, were regular tasks, blue cards designated technical stories such as refactoring or spikes, and pink cards, shown toward the right-hand side of the board as the darkest color, were bugs that need to be addressed. It is easy to see that this picture was taken at the beginning of an iteration because there are no colored circles on each card. In the top right-hand corner, you can see the legend. Blue stickers meant it has been coded, green would indicate done (tested), and red meant the task has been deemed not completed or a bug was rejected as not fixed. As a task or story was completed (i.e., green sticker), it was moved to the right of the board.
—Janet
Lisa’s Story
For more than four years, our story board was a couple of sheets of sheet metal, painted in company colors, using color-coded index cards attached to the board with magnets. Figure 15-9 shows a picture of it early in an iteration. Our task cards were also color-coded: white for development tasks, green for coding tasks, yellow and red for bugs, and striped for cards not originally planned in the iteration. The board was so effective in indicating our progress that we eventually stopped bothering with a task burndown chart. It let us focus on completing one story at a time. We also used it to post other big visible charts, such as a big red sign showing the build had failed. We loved our board.
Figure 15-9 Another sample story board. Used with permission of Mike Thomas. Copyright 2008.
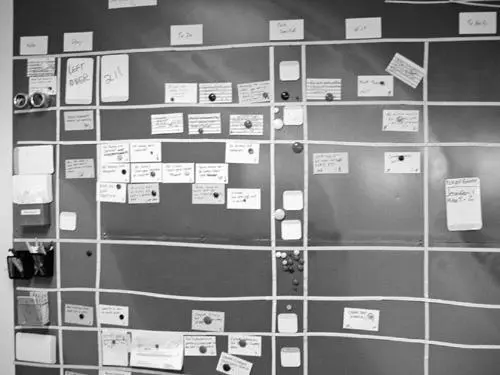
Then, one of our team members moved overseas. We tried using a spreadsheet along with our physical story board, but our remote teammate found the spreadsheet too hard to use. We tried several software packages designed for Scrum teams, but they were so different from our real story board that we couldn’t adjust to using them. We finally found a product (Mingle) that looked and worked enough like our physical board that everyone, including our remote person, could use it. We painted our old story board white, and now we can project the story board on the wall during stand-up meetings.
—Lisa
Distributed teams need some kind of online story board. This might be a spreadsheet, or specialized software that mimics a physical story board as Mingle does.
Communicating Test Results
Earlier, we talked about planning how to track test results. Now we want to talk about effectively communicating them. Test results are one of the most important ways to measure progress, see whether new tests are being written and run for each story, and whether they’re all passing. Some teams post big visible charts of the number of tests written, run, and passed. Others have their build process email automated test results to team members and stakeholders. Some continuous integration tools provide GUI tools to monitor builds and build results.
We’ve heard of teams that have a projector hooked up to the machine that runs FitNesse tests on a continuous build and displays the test results at all times. Test results are a concrete depiction of the team’s progress. If the number of tests doesn’t go up every day or every iteration, that might indicate a problem. Either the team isn’t writing tests (assuming they’re developing test-first), or they aren’t getting much code completed. Of course, it’s possible they are ripping out old code and the tests that went with it. It’s important to analyze why trends are going the wrong way. The next section gives you some ideas about the types of metrics you may want to gather and display.
However your team decides they want to communicate your progress, make sure you think about it up front and everyone gets value from it.
Release Metrics
We include this section here, because it is important to understand what metrics you want to gather from the very beginning of a release. These metrics should give you continual feedback about how development is proceeding, so that you can respond to unexpected events and change your process as needed. Remember, you need to understand what problem you are trying to solve with your metrics so that you can track the right ones. The metrics we talk about here are just some examples that you may choose to track.
Number of Passing Tests
Many agile teams track the number of tests at each level: unit, functional, story tests, GUI, load, and so on. The trend is more important than the number. We get a warm fuzzy feeling seeing the number of tests go up. A number without context is just a number, though. For example, if a team says it has 1000 tests, what does that mean? Do 1000 tests give 10% or 90% coverage? What happens when code that has tests is removed?
Tracking the number of tests written, running, and passing at a story level is one way to show a story’s status. The number of tests written shows progress of tests to drive development. Knowing how many tests aren’t passing yet gives you an idea of how much code still needs to be written.
After a test passes, it needs to stay “green” as long as the functionality is present in the code. Graphs of the number of tests passing and failing over time show whether there’s a problem with regression failures and also show the growth of the code base. Again, it’s the trend that’s important. Watch for anomalies.
Читать дальшеИнтервал:
Закладка:
Похожие книги на «Agile Testing: A Practical Guide for Testers and Agile Teams»
Представляем Вашему вниманию похожие книги на «Agile Testing: A Practical Guide for Testers and Agile Teams» списком для выбора. Мы отобрали схожую по названию и смыслу литературу в надежде предоставить читателям больше вариантов отыскать новые, интересные, ещё непрочитанные произведения.


Обсуждение, отзывы о книге «Agile Testing: A Practical Guide for Testers and Agile Teams» и просто собственные мнения читателей. Оставьте ваши комментарии, напишите, что Вы думаете о произведении, его смысле или главных героях. Укажите что конкретно понравилось, а что нет, и почему Вы так считаете.