Lloyd Minor - Discovering Precision Health
Здесь есть возможность читать онлайн «Lloyd Minor - Discovering Precision Health» — ознакомительный отрывок электронной книги совершенно бесплатно, а после прочтения отрывка купить полную версию. В некоторых случаях можно слушать аудио, скачать через торрент в формате fb2 и присутствует краткое содержание. Жанр: unrecognised, на английском языке. Описание произведения, (предисловие) а так же отзывы посетителей доступны на портале библиотеки ЛибКат.
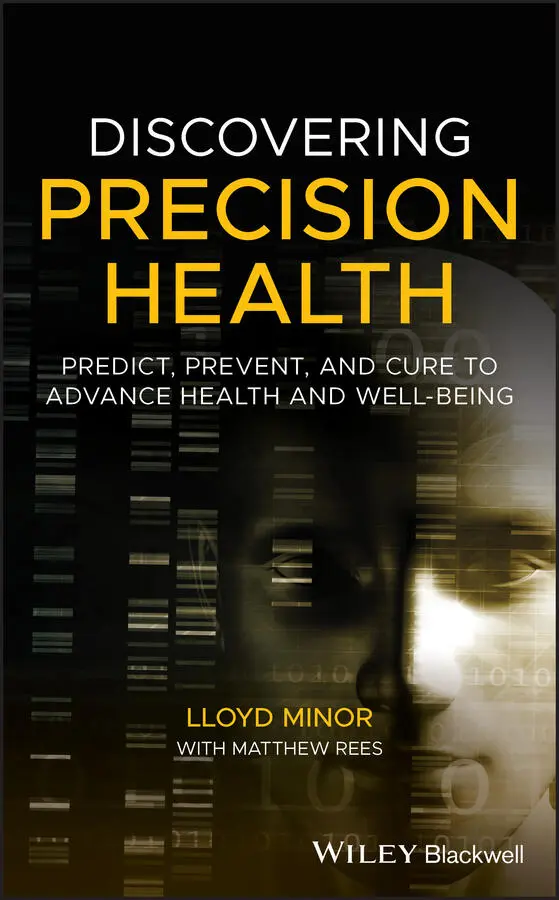
- Название:Discovering Precision Health
- Автор:
- Жанр:
- Год:неизвестен
- ISBN:нет данных
- Рейтинг книги:4 / 5. Голосов: 1
-
Избранное:Добавить в избранное
- Отзывы:
-
Ваша оценка:
Discovering Precision Health: краткое содержание, описание и аннотация
Предлагаем к чтению аннотацию, описание, краткое содержание или предисловие (зависит от того, что написал сам автор книги «Discovering Precision Health»). Если вы не нашли необходимую информацию о книге — напишите в комментариях, мы постараемся отыскать её.
The U.S. health care system is designed to be reactive instead of preventive. The result is diagnoses that are too late and outcomes that are far worse than our level of spending should deliver. In recent years, U.S. life expectancy has been declining.
Fundamental to realizing better health, and a more effective health care system, is advancing the disruptive thinking that has spawned innovation in Silicon Valley and throughout the world. That's exactly what Stanford Medicine has done by proposing a new vision for health and health care. In
,
and
describe a holistic approach that will set health care on the right track: keep people healthy by preventing disease before it starts and personalize the treatment of individuals precisely, based on their specific profile.
With descriptions of the pioneering work undertaken at Stanford Medicine, complemented by fascinating case studies of innovations from entities including the Chan Zuckerberg Biohub, GRAIL, and Impossible Foods, Minor and Rees present a dynamic vision for the future of individual health and health care. You'll see how tools from smartphone technology to genome sequencing to routine blood tests are helping avert illness and promote health. And you'll learn about the promising progress already underway in bringing greater precision to the process of predicting, preventing, and treating a range of conditions, including allergies, mental illness, preterm birth, cancer, stroke, and autism.
The book highlights how biomedical advances are dramatically improving our ability to treat and cure complex diseases, while emphasizing the need to devote more attention to social, behavioral, and environmental factors that are often the primary determinants of health.
The authors explore thought-provoking topics including: The unlikely role of Google Glass in treating autism How gene editing can advance precision in treating disease What medicine can learn from aviation <liHow digital tools can contribute to health and innovation
showcases entirely new ways of thinking about health and health care and can help empower us to lead healthier lives.
Discovering Precision Health — читать онлайн ознакомительный отрывок
Ниже представлен текст книги, разбитый по страницам. Система сохранения места последней прочитанной страницы, позволяет с удобством читать онлайн бесплатно книгу «Discovering Precision Health», без необходимости каждый раз заново искать на чём Вы остановились. Поставьте закладку, и сможете в любой момент перейти на страницу, на которой закончили чтение.
Интервал:
Закладка:
The cell atlas initiative of the Chan Zuckerberg Biohub focuses on building a repository of all the different cell types in the human body—something that is currently unknown. Understanding all the different cell types is crucial, points out Steve Quake, a Stanford professor and co‐president of the Chan Zuckerberg Biohub: “Having this knowledge will lead to greater understanding of the basic biology of human beings as well as what goes wrong and causes disease” [1]. It will be enabled by exciting new technologies such as CRISPR (“Clustered Regularly Interspaced Short Palindromic Repeats”), a gene‐editing tool that will be used for experiments exploring whether certain combinations of genes can halt the progression of a disease—or even reverse it. The findings can be the basis for new medicines and new tests that are focused on combating specific diseases.
As breakthroughs like these are pursued, we are seeing the adoption of various technology‐based products that are enabling people to become more engaged with their health and, ultimately, to live longer, healthier lives.
But set against this hopeful environment is an altogether different reality: certain segments of the U.S. population are experiencing a decline in basic indicators of good health. There are many ways to illustrate this decline, but life expectancy is perhaps the easiest to understand.
At the beginning of the 20 thcentury, U.S. life expectancy was just 47.3 years. That figure rose steadily in the decades that followed, thanks in large part to medical advances, and by the start of the 21 stcentury U.S. life expectancy was 76.8 years [2]. For the next 14 years, the incremental gains continued. But then something happened.
In 2015, life expectancy declined. Then it happened again in 2016, and again in 2017. This was the first decline in U.S. life expectancy over three consecutive years since the period coinciding with the end of World War I and the Spanish influenza. While the declines were quite modest, they did help illuminate the U.S. health challenges. The declines were also a reminder that the United States fares poorly in international comparisons. U.S. life expectancy is now only the 43 rdhighest in the world [3]—in 1960, the U.S. ranked 13 th[4].
The U.S. average masks wide disparities. For example, there is a six‐year difference in life expectancy between the residents of Hawaii and Mississippi, according to a study published in the Journal of the American Medical Association in 2017. There is a 20‐year difference between one county in Colorado and one in South Dakota [5].
There is also a large life expectancy gap based on income. Men with earnings in the top 1 percent of the population live 14.6 years longer than men in the bottom 1 percent (among women, the gap is 10.1 years), according to a 2016 study coauthored by economist Raj Chetty [6]. While men in the top 5 percent of the income distribution saw their life expectancy increase by 2.3 years between 2001 and 2014, it only grew 0.32 years for those in the bottom 5 percent. The gap was even larger among women—2.91 years and 0.04 years, respectively [7].
The gap is not just between the very rich and the very poor. In recent years, the mortality rate for men ages 65–79 in the top 1 percent of wealth distribution has been 40 percent lower than the average mortality rates for all tax filers in that age bracket, according to UC Berkeley economists Emmanuel Saez and Gabriel Zucman. From 1979 to 1983, the difference between the top 1 percent and everyone else was just 10 percent [8].
A study conducted by seven professors at the Stanford School of Medicine, led by Latha Palaniappan, documented the persistence of U.S. health disparities from 2003 to 2015. The study, which was published in November 2018, showed that while the age‐ and sex‐adjusted mortality rates decreased by 12 percent in the total population, high‐income counties experienced a 15 percent decline, while in low‐income counties the decline was only 7 percent. Similarly, adjusted mortality rates for heart disease declined 30 percent in high‐income counties, but 22 percent in low‐income counties. The study also showed that African Americans have a higher mortality rate than other groups (Asian Americans, Hispanics, non‐Hispanic whites, and American Indians/Alaska Natives) [9].
These disparities highlight the need for remedies that will help those who are falling behind. One of the most disturbing facts about U.S. health is the number of people who die prematurely each year and the causes of those deaths. The authors of a 2013 report sponsored by the National Institutes of Health wrote that “Americans are dying and suffering from illness and injury at rates that are demonstrably unnecessary” [10].
The causes of those deaths were spelled out in another comprehensive study, which was published in 2013 in the Journal of the American Medical Association . The researchers found that the primary causes of U.S. morbidity and mortality were poor diet, obesity, smoking, and high blood pressure [11]. The study has continued to be updated, and there is extensive data comparing current trends with those that existed in 1990. Some of the news is encouraging: the number of people dying from ischemic heart disease declined by nearly 100,000. On the other hand, heart disease was still responsible for nearly 545,000 deaths—well more than twice the number of deaths from any other condition. (The second‐biggest killer in 2016 was Alzheimer’s and other dementias, which were responsible for close to 239,000 deaths [12].)
When deaths were broken out by causes, and not specific diseases, one factor stood out from the rest: diet. The researchers found that “dietary risks” accounted for close to 530,000 deaths in 2016. Nearly 84 percent of the deaths stemmed from cardiovascular diseases, and the rest stemmed from a combination of neoplasms and diabetes, as well as urogenital, blood, and endocrine diseases [13].
The dietary risks are reflected in the expanding waistlines of the American people. Today, nearly 40 percent of American adults qualify as obese (meaning a body mass index of 30 or higher), as do 18.5 percent of children 19 and under [14]. The only countries with higher obesity rates (not counting a number of tiny Pacific and Caribbean islands) are Kuwait, Belize, Qatar, and Egypt.
What’s striking is how quickly the profile of the American population changed. As recently as 1980, just 10 percent of the U.S. population was obese. Although obesity rates have been rising globally—there’s been a tenfold increase in childhood obesity over the past 40 years [15]—the percentage point increase in American obesity since 1980 has been greater than in any other country in the world, according to a study published in 2017 in the New England Journal of Medicine [16].
The reasons for this decline in health are varied, and they speak to the need for new approaches to health—particularly focused on prediction and prevention. In later chapters, I highlight how select initiatives can not only treat obesity but try to prevent it (particularly in children) by emphasizing the value of both a healthy diet and regular physical activity.
THE U.S. HEALTH CARE CONUNDRUM
Health care is one of the most debated subjects in the United States. Consider the passionate feelings about the Affordable Care Act—better known as Obamacare—and whether to preserve it, reform it, or repeal it. What’s striking about U.S. public opinion related to health care is not the divide between Republicans and Democrats but rather the differences in how people feel about the care they receive versus the system that provides that care.
In November 2017, the Gallup organization asked more than 1,000 people to rate the quality of care that they received, and 77 percent said it was “excellent” or “good.” There’s been little fluctuation in that number dating back to 2001 [17]. But when people were asked to describe the state of the U.S. health care system, 71 percent said it was “in a state of crisis”—a sentiment that has not changed much since 2008 [18].
Читать дальшеИнтервал:
Закладка:
Похожие книги на «Discovering Precision Health»
Представляем Вашему вниманию похожие книги на «Discovering Precision Health» списком для выбора. Мы отобрали схожую по названию и смыслу литературу в надежде предоставить читателям больше вариантов отыскать новые, интересные, ещё непрочитанные произведения.










Обсуждение, отзывы о книге «Discovering Precision Health» и просто собственные мнения читателей. Оставьте ваши комментарии, напишите, что Вы думаете о произведении, его смысле или главных героях. Укажите что конкретно понравилось, а что нет, и почему Вы так считаете.