Bhisham C. Gupta - Statistics and Probability with Applications for Engineers and Scientists Using MINITAB, R and JMP
Здесь есть возможность читать онлайн «Bhisham C. Gupta - Statistics and Probability with Applications for Engineers and Scientists Using MINITAB, R and JMP» — ознакомительный отрывок электронной книги совершенно бесплатно, а после прочтения отрывка купить полную версию. В некоторых случаях можно слушать аудио, скачать через торрент в формате fb2 и присутствует краткое содержание. Жанр: unrecognised, на английском языке. Описание произведения, (предисловие) а так же отзывы посетителей доступны на портале библиотеки ЛибКат.

- Название:Statistics and Probability with Applications for Engineers and Scientists Using MINITAB, R and JMP
- Автор:
- Жанр:
- Год:неизвестен
- ISBN:нет данных
- Рейтинг книги:4 / 5. Голосов: 1
-
Избранное:Добавить в избранное
- Отзывы:
-
Ваша оценка:
Statistics and Probability with Applications for Engineers and Scientists Using MINITAB, R and JMP: краткое содержание, описание и аннотация
Предлагаем к чтению аннотацию, описание, краткое содержание или предисловие (зависит от того, что написал сам автор книги «Statistics and Probability with Applications for Engineers and Scientists Using MINITAB, R and JMP»). Если вы не нашли необходимую информацию о книге — напишите в комментариях, мы постараемся отыскать её.
Statistics and Probability with Applications for Engineers and Scientists using MINITAB, R and JMP, Second Edition Features two new chapters—one on Data Mining and another on Cluster Analysis Now contains R exhibits including code, graphical display, and some results MINITAB and JMP have been updated to their latest versions Emphasizes the p-value approach and includes related practical interpretations Offers a more applied statistical focus, and features modified examples to better exhibit statistical concepts Supplemented with an Instructor's-only solutions manual on a book’s companion website
is an excellent text for graduate level data science students, and engineers and scientists. It is also an ideal introduction to applied statistics and probability for undergraduate students in engineering and the natural sciences.
Statistics and Probability with Applications for Engineers and Scientists Using MINITAB, R and JMP — читать онлайн ознакомительный отрывок
Ниже представлен текст книги, разбитый по страницам. Система сохранения места последней прочитанной страницы, позволяет с удобством читать онлайн бесплатно книгу «Statistics and Probability with Applications for Engineers and Scientists Using MINITAB, R and JMP», без необходимости каждый раз заново искать на чём Вы остановились. Поставьте закладку, и сможете в любой момент перейти на страницу, на которой закончили чтение.
Интервал:
Закладка:
1.1 Designed Experiment
We discuss the concept of a designed experiment with an example, “Development of Screening Facility for Storm Water Overflows” (taken from Box et al., 1978, and used with permission). The example illustrates how a sequence of experiments can enable scientists to gain knowledge of the various important factors affecting the problem and give insight into the objectives of the investigation. It also indicates how unexpected features of the problem can become dominant, and how experimental difficulties can occur so that certain planned experiments cannot be run at all. Most of all, this example shows the importance of common sense in the conduct of any experimental investigation. The reader may rightly conclude from this example that the course of a real investigation, like that of true love, seldom runs smoothly, although the eventual outcome may be satisfactory.
1.1.1 Motivation for the Study
During heavy rainstorms, the total flow coming to a sewage treatment plant may exceed its capacity, making it necessary to bypass the excess flow around the treatment plant, as shown in Figure 1.1.1a. Unfortunately, the storm overflow of untreated sewage causes pollution of the receiving body of water. A possible alternative, sketched in Figure 1.1.1b, is to screen most of the solids out of the overflow in some way and return them to the plant for treatment. Only the less objectionable screened overflow is discharged directly to the river.
To determine whether it was economical to construct and operate such a screening facility, the Federal Water Pollution Control Administration of the Department of the Interior sponsored a research project at the Sullivan Gulch pump station in Portland, Oregon. Usually, the flow to the pump station was 20 million gallons per day (mgd), but during a storm, the flow could exceed 50 mgd.
Figure 1.1.2a shows the original version of the experimental screening unit, which could handle approximately 1000 gallons per minute (gpm). Figure 1.1.2a is a perspective view, and Figure 1.1.2b is a simplified schematic diagram. A single unit was about seven ft high and seven ft in diameter. The flow of raw sewage struck a rotating collar screen at a velocity of five to 15 ft/s. This speed was a function of the flow rate into the unit and hence a function of the diameter of the influent pipe. Depending on the speed of the rotation of this screen and its fineness, up to 90% of the feed penetrated the collar screen. The rest of the feed dropped to the horizontal screen, which vibrated to remove excess water. The solids concentrate, which passed through neither screen, was sent to the sewage treatment plant. Unfortunately, during operation, the screens became clogged with solid matter, not only sewage but also oil, paint, and fish‐packing wastes. Backwash sprays were therefore installed for both screens to permit cleaning during operation.
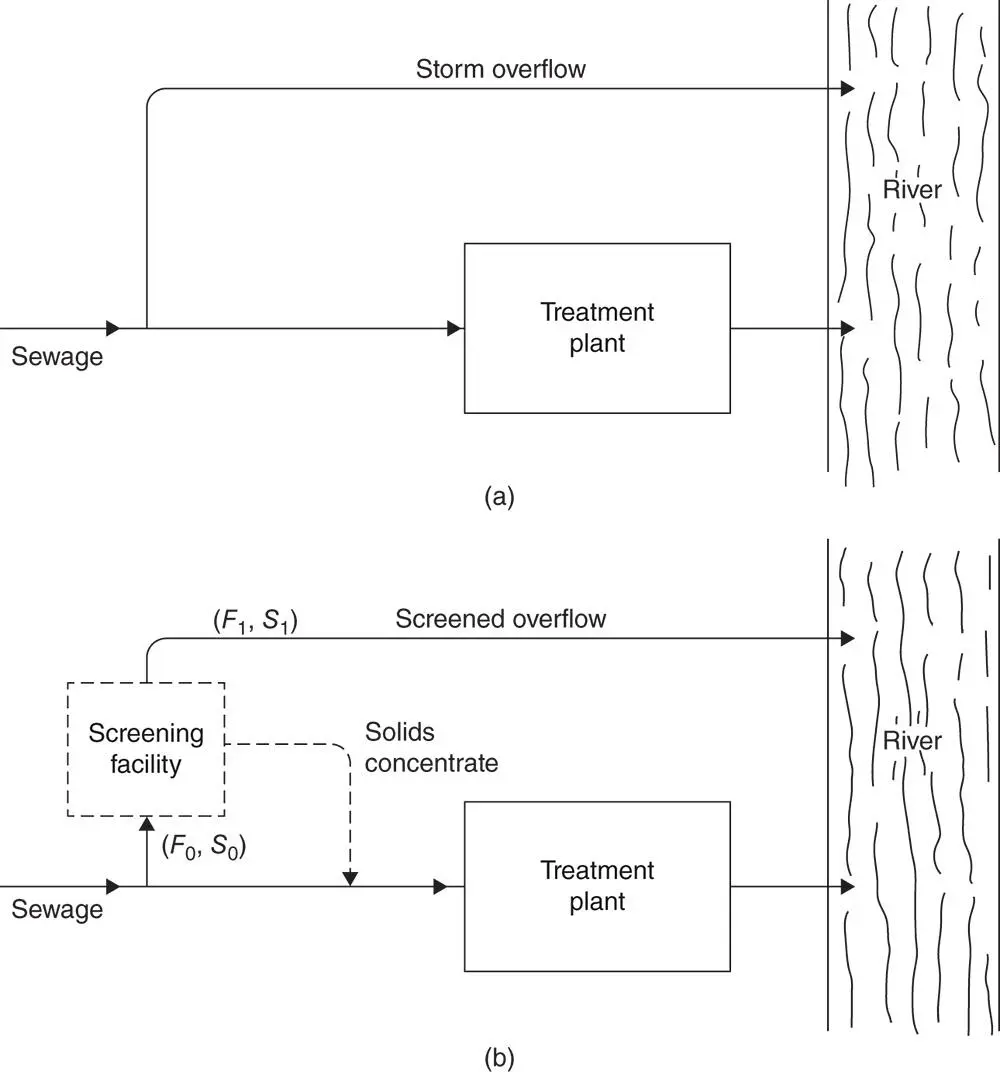
Figure 1.1.1Operation of the sewage treatment plant: (a) standard mode of operation and (b) modified mode of operation, with screening facility, F = flow; S = settleable solids.
1.1.2 Investigation
The objective of the investigation was to determine good operating conditions.
1.1.3 Changing Criteria
What are good operating conditions? Initially, it was believed they were those resulting in the highest possible removal of solids. Referring to Figures 1.1.1b and 1.1.2a, settleable solids in the influent are denoted by  and the settleable solids in the effluent by
  . The percent solids removed by the screen is therefore
 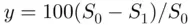 . Thus, initially, it was believed that good operation meant achieving a high value for y . However, it became evident after the first set of experiments were made, that the percentage of the flow retreated (flow returned to treatment plant), which we denote by z , also had to be taken into account. Referring to Figures 1.1.1b and 1.1.2a, influent flow to the screens is denoted by
  and effluent flow from the screens to the river by
  . Thus,
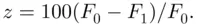
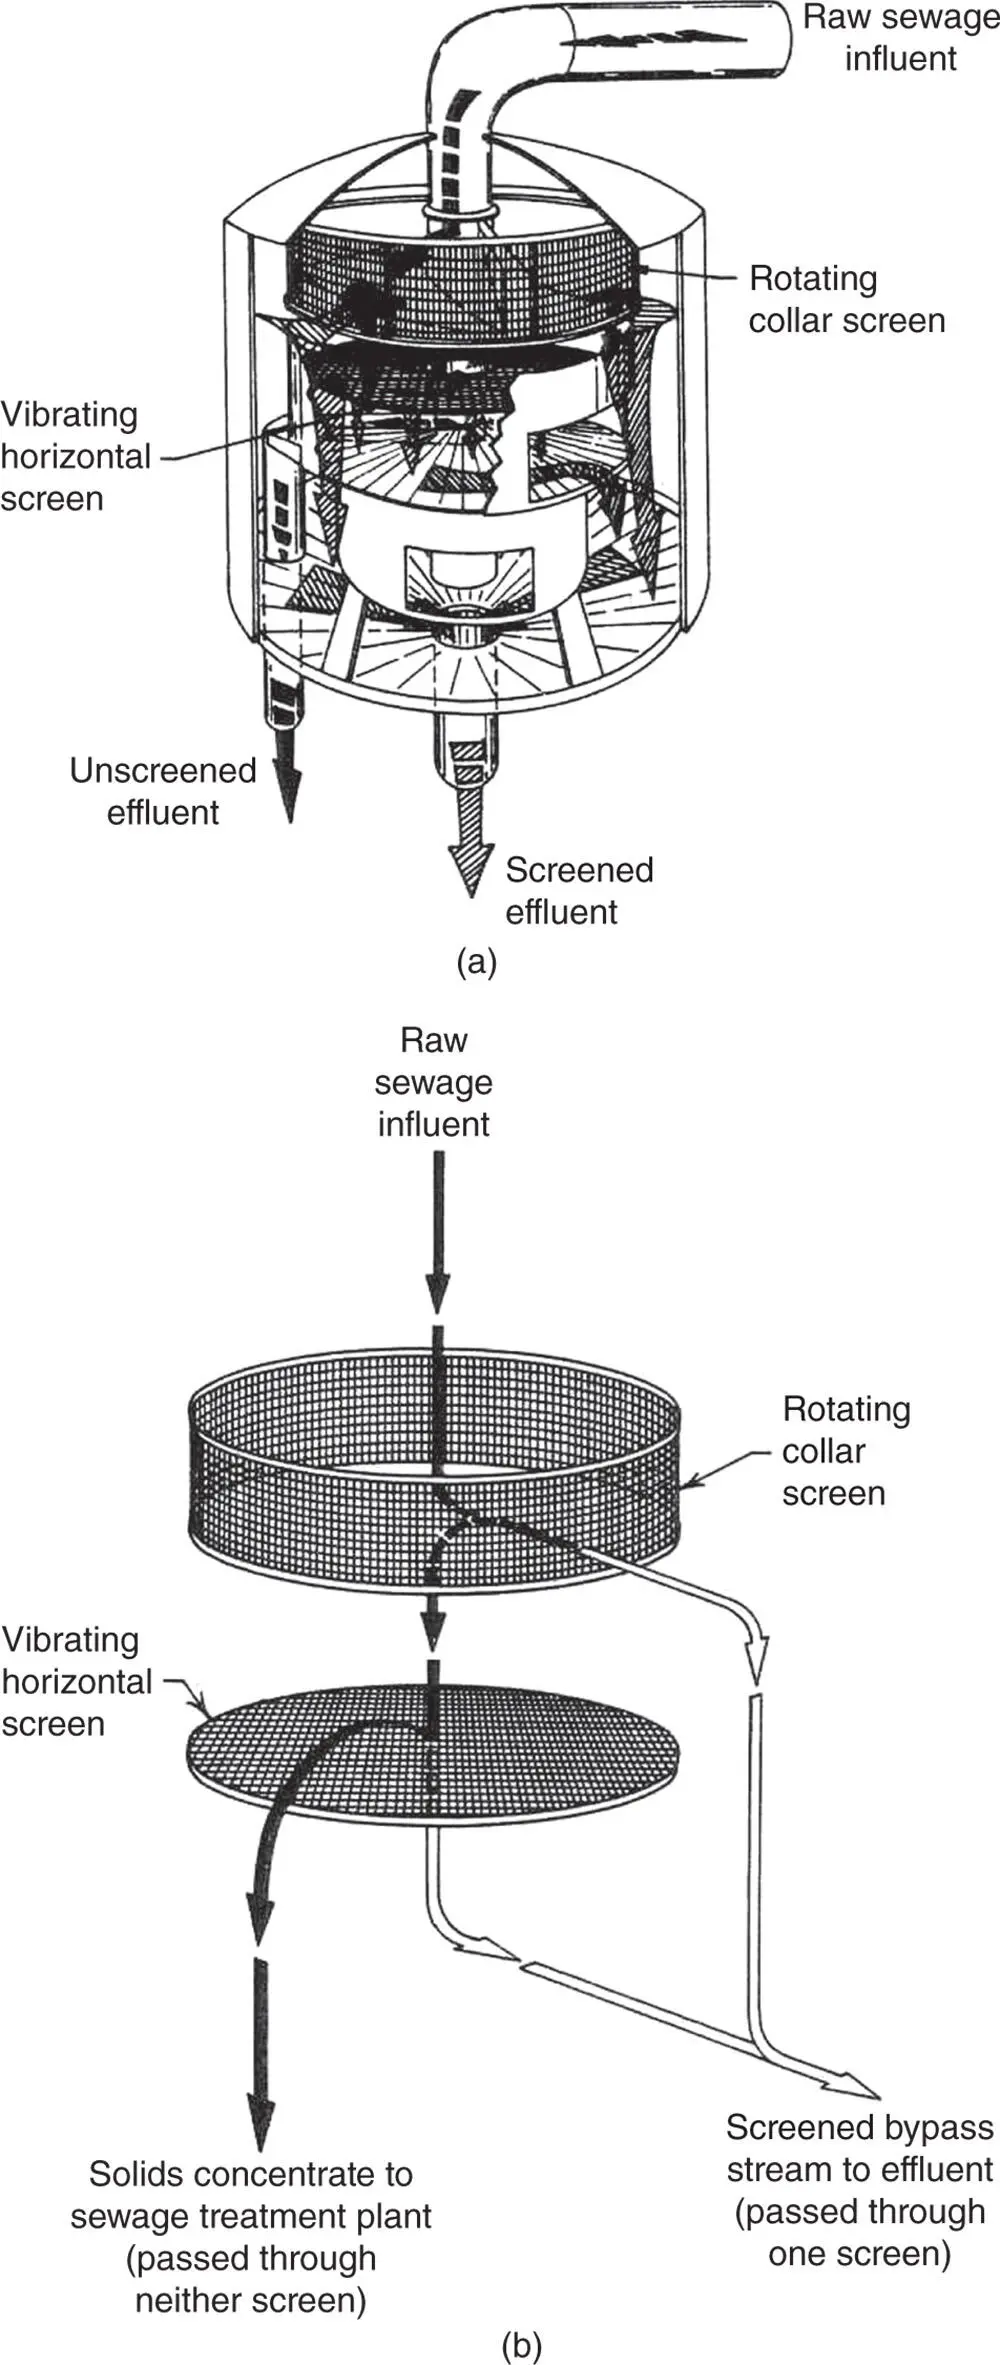
Figure 1.1.2Original version of the screening unit (a) detailed diagram and (b) simplified diagram.
1.1.4 A Summary of the Various Phases of the Investigation
Phase a
In this initial phase, an experiment was run in which the roles of three variables were studied: collar screen mesh size (fine, coarse), horizontal screen mesh size (fine, coarse), and flow rate (gpm). At this stage,
1 The experimenters were encouraged by the generally high values achieved for y.
2 Highest values for y were apparently achieved by using a horizontal screen with a coarse mesh and a collar screen with fine mesh.
3 Contrary to expectation, flow rate did not show up as an important variable affecting y.
4 Most important, the experiment was unexpectedly dominated by the values, which measure the flow retreated. These were uniformly very low, with about 0.01% of the flow being returned to the treatment plant and 99.9% leaving the screen for discharge into the river. Although it was desirable that the retreated flow be small, the values were embarrassingly low. As the experimenters remarked, “[T]he horizontal screen produced a solid concentratedry enough to shovel. This represented a waste of effort of concentrating because the concentrated solids were intended to flow from the units.”
Phase b
It was now clear (i) that  as well as
  were important and (ii) that
  was too low. It was conjectured that the matters might be improved by removing the horizontal screen altogether. Another experiment was therefore performed with no horizontal screen. The speed of rotation of the collar screen was introduced as a new variable.
Unfortunately, after only two runs of this experiment, this particular phase had to be terminated because of the excessive tearing of the cloth screens. From the scanty results obtained it appeared, however, that with no horizontal screen high solid removal could be achieved with a higher portion of the flow retreated. It was therefore decided to repeat these runs with screens made of stainless steel instead of cloth.
Читать дальшеИнтервал:
Закладка:
Похожие книги на «Statistics and Probability with Applications for Engineers and Scientists Using MINITAB, R and JMP»
Представляем Вашему вниманию похожие книги на «Statistics and Probability with Applications for Engineers and Scientists Using MINITAB, R and JMP» списком для выбора. Мы отобрали схожую по названию и смыслу литературу в надежде предоставить читателям больше вариантов отыскать новые, интересные, ещё непрочитанные произведения.


Обсуждение, отзывы о книге «Statistics and Probability with Applications for Engineers and Scientists Using MINITAB, R and JMP» и просто собственные мнения читателей. Оставьте ваши комментарии, напишите, что Вы думаете о произведении, его смысле или главных героях. Укажите что конкретно понравилось, а что нет, и почему Вы так считаете.