Steven Abrahams - Competitive Advantage in Investing
Здесь есть возможность читать онлайн «Steven Abrahams - Competitive Advantage in Investing» — ознакомительный отрывок электронной книги совершенно бесплатно, а после прочтения отрывка купить полную версию. В некоторых случаях можно слушать аудио, скачать через торрент в формате fb2 и присутствует краткое содержание. Жанр: unrecognised, на английском языке. Описание произведения, (предисловие) а так же отзывы посетителей доступны на портале библиотеки ЛибКат.
- Название:Competitive Advantage in Investing
- Автор:
- Жанр:
- Год:неизвестен
- ISBN:нет данных
- Рейтинг книги:3 / 5. Голосов: 1
-
Избранное:Добавить в избранное
- Отзывы:
-
Ваша оценка:
Competitive Advantage in Investing: краткое содержание, описание и аннотация
Предлагаем к чтению аннотацию, описание, краткое содержание или предисловие (зависит от того, что написал сам автор книги «Competitive Advantage in Investing»). Если вы не нашли необходимую информацию о книге — напишите в комментариях, мы постараемся отыскать её.
fills the gap by integrating modern portfolio theory with actual practice in one comprehensive volume.
This innovative book guides investment professionals on building and sustaining competitive advantage and helps policymakers and researchers apply theory in a wide range of practical settings. Author Steven Abrahams—Senior Managing Director at Amherst Pierpont Securities and former Adjunct Professor of Finance and Economics at Columbia Business School—draws from his experience in both academic theory and real-life strategic investing to bridge the two worlds. This valuable resource:
Connects the formal literature on investing to the actual work of most institutional portfolio managers Examines core strengths and weaknesses that drive portfolio behavior at mutual and hedge funds, banks and insurers, at other institutions and for individuals Demonstrates how linking portfolio theory and practice can increase competitive advantage Offers a robust description of investing, markets, and asset value
is a must-have book for any investment professional, policymaker, or researcher.
Competitive Advantage in Investing — читать онлайн ознакомительный отрывок
Ниже представлен текст книги, разбитый по страницам. Система сохранения места последней прочитанной страницы, позволяет с удобством читать онлайн бесплатно книгу «Competitive Advantage in Investing», без необходимости каждый раз заново искать на чём Вы остановились. Поставьте закладку, и сможете в любой момент перейти на страницу, на которой закончили чтение.
Интервал:
Закладка:

In this test, if CAPM described the world well, the value of α ishould be zero. That was one place where analysts could test CAPM theory against actual investment results. A number of analysts did exactly that (Douglas, 1968; Black, Jensen, and Scholes, 1972; Miller and Scholes, 1972; Blume and Friend, 1973; Fama and MacBeth, 1973; Fama and French, 1992).
When investors followed Jensen's lead and tested CAPM they found that not only did α ihave a value other than zero but also it followed a surprising but reliable pattern:  had a positive value when
  is low and a negative value when
  is high. In other words, more stable assets had a better return than predicted by CAPM and more volatile assets had a worse return. The capital markets line in the real world was flatter than predicted by theory.
As recently as 2004, Eugene Fama at the University of Chicago and Kenneth French at Dartmouth again ran the numbers on portfolios of stocks built to be either high or low beta (Fama and French, 2004). Assembling these portfolios at the beginning of each year, they looked at performance over the year that followed. CAPM would predict that the safest portfolio of stocks would return only slightly more than the riskless rate for the year. As portfolios became riskier, their return simply would be the excess return of the market portfolio that year multiplied by each portfolio beta. Testing from 1928 through 2003, they compared actual returns on these portfolios to returns predicted by CAPM. They found that low beta stocks had returns higher than predicted, and high beta stocks had returns lower than predicted ( figure 3.1). Again, the line was too flat.
Higher beta investments still showed higher returns, but the flatness of the observed capital markets line suggested that CAPM alone might not explain it. The theory had a mysterious flaw.
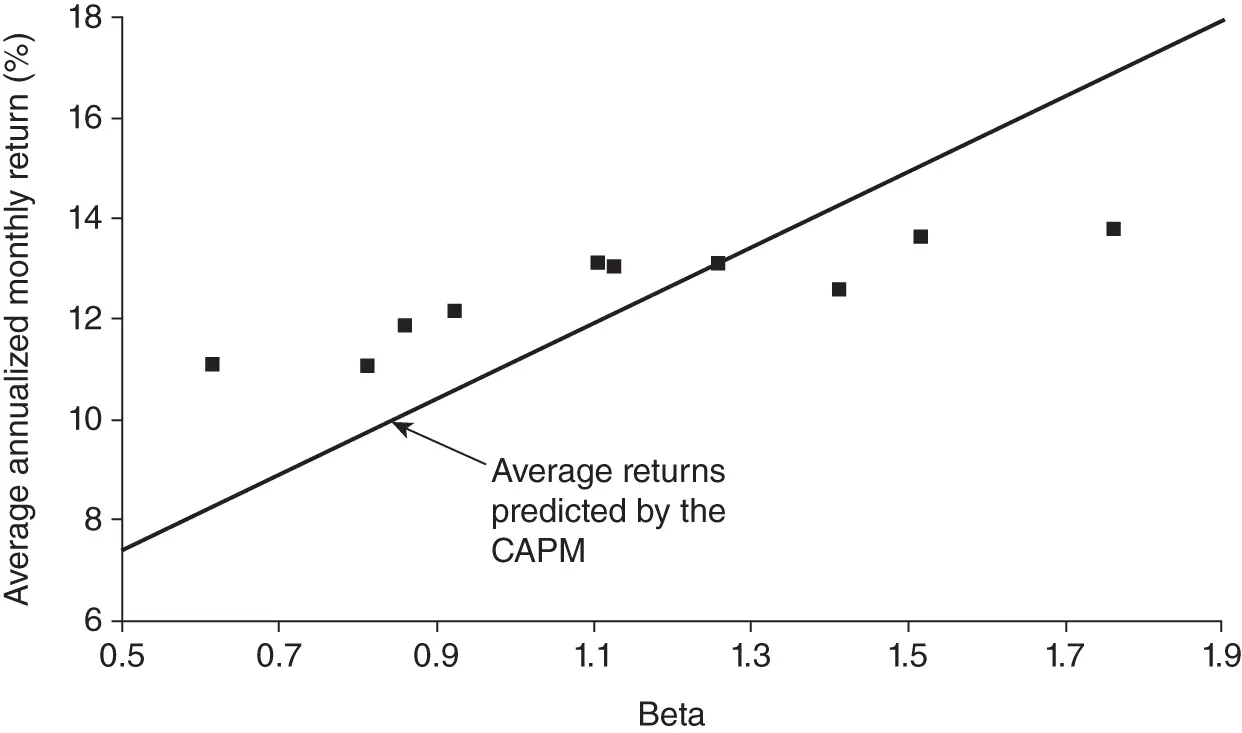
Figure 3.1 On stock portfolios that vary in their beta, realized returns are too flat compared to the predictions of CAPM.
Note: Average annualized monthly return versus beta for value-weight portfolios formed on prior beta, 1928–2003.
Source: From Fama and French (2004).
Performance Turns on More Than Beta
CAPM also predicted that investment returns depend only on an asset's expected return premium over the riskless rate, or  . This ensures that the market portfolio sits somewhere on Markowitz's efficient frontier. If other factors influence asset returns, then the simplest and most elegant version of CAPM falls apart.
Starting in the late 1970s, studies of investment returns started making the case that factors other than expected return premium explained asset returns. A study by Sanjay Basu showed that earnings-to-price ratios added to the ability of CAPM to predict stock returns, with high earnings-to-price equities outperforming low (Basu, 1977). A study by Rolf Banz a few years later showed that market capitalization helped, too, with smaller market capitalizations performing better than predicted by CAPM (Banz, 1981). Laxmi Bhandari followed this lead and by the end of the 1980s found that debt-to-equity ratios helped CAPM explain returns, with high debt-to-equity performing better than predicted by beta alone (Bhandari, 1988). And other researchers found that high book-to-market equities also performed better than predicted by beta (Stattman, 1980; Rosenberg, Reid, and Lanstein, 1985).
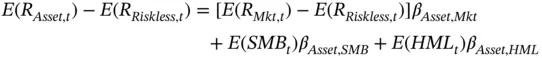
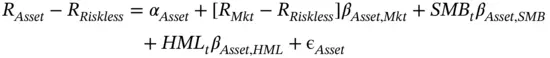
Eugene Fama and Kenneth French later incorporated influences beyond beta into a proposed model of asset returns (Fama and French, 1993, 1996). In their view of the investment world, the expected excess return on any specific asset at a point in time, 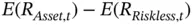 , again depends on the excess return on the market portfolio multiplied by the CAPM's familiar beta,
  . But unlike CAPM, Fama and French also argue that returns depend on the difference between small and big stocks, or
  , and on the difference between stocks with a high ratio of book value to market value and stocks with a low ratio, or
  . These factors represent elements of asset returns separate from broad exposure to the economy and, more important, elements that investors cannot diversify away. Investors consequently need compensation for those risks.
Fama and French fit the elements of their approach together in a single statement:
Fama and French point out that the average annual excess return of the market portfolio over the riskless rate from 1927 to 2003 was 8.3%. The average difference in return between small and large stocks, however, was 3.6%, and the average difference between high and low book-to-market stocks was 5.0%. They also put their approach to the same test that Jensen applied to CAPM:
In this test, if Fama and French's model described the world well, the value of α ialso should be zero. Fama and French have broadly found that this approach does leave a value of α iabout zero. Work by other researchers has found similar results (see, for example, Loughran and Ritter, 1995; Mitchell and Stafford, 2000). Studies of performance in mutual funds have also found that Fama and French's factors explain performance better than a simple CAPM approach (Carhart, 1997). Beyond the academic, investment firms such as Dimensional Advisors and AQR have built substantial businesses on Fama and French's observation, running portfolios that use these factors to try to outperform broad market benchmarks.
In addition to Fama and French, other work has found more factors that seem to sway asset returns. Jegadeesh and Titman have found that returns seem to depend on a sort of momentum (Jegadeesh and Titman, 1993). Stocks that do better than the market over the most recent three or 12 months tend to continue doing well over the next few months, and stocks that do poorly continue doing poorly. Performance seems to persist and shape returns beyond even the factors that Fama and French describe. The list of influences on asset return grows.
Читать дальшеИнтервал:
Закладка:
Похожие книги на «Competitive Advantage in Investing»
Представляем Вашему вниманию похожие книги на «Competitive Advantage in Investing» списком для выбора. Мы отобрали схожую по названию и смыслу литературу в надежде предоставить читателям больше вариантов отыскать новые, интересные, ещё непрочитанные произведения.


Обсуждение, отзывы о книге «Competitive Advantage in Investing» и просто собственные мнения читателей. Оставьте ваши комментарии, напишите, что Вы думаете о произведении, его смысле или главных героях. Укажите что конкретно понравилось, а что нет, и почему Вы так считаете.