Michael G. Solomon - Blockchain Data Analytics For Dummies
Здесь есть возможность читать онлайн «Michael G. Solomon - Blockchain Data Analytics For Dummies» — ознакомительный отрывок электронной книги совершенно бесплатно, а после прочтения отрывка купить полную версию. В некоторых случаях можно слушать аудио, скачать через торрент в формате fb2 и присутствует краткое содержание. Жанр: unrecognised, на английском языке. Описание произведения, (предисловие) а так же отзывы посетителей доступны на портале библиотеки ЛибКат.
- Название:Blockchain Data Analytics For Dummies
- Автор:
- Жанр:
- Год:неизвестен
- ISBN:нет данных
- Рейтинг книги:5 / 5. Голосов: 1
-
Избранное:Добавить в избранное
- Отзывы:
-
Ваша оценка:
Blockchain Data Analytics For Dummies: краткое содержание, описание и аннотация
Предлагаем к чтению аннотацию, описание, краткое содержание или предисловие (зависит от того, что написал сам автор книги «Blockchain Data Analytics For Dummies»). Если вы не нашли необходимую информацию о книге — напишите в комментариях, мы постараемся отыскать её.
is your quick-start guide to harnessing the potential of blockchain.
Inside this book, technologists, executives, and data managers will find information and inspiration to adopt blockchain as a big data tool. Blockchain expert Michael G. Solomon shares his insight on what the blockchain is and how this new tech is poised to disrupt data. Set your organization on the cutting edge of analytics, before your competitors get there!
Learn how blockchain technologies work and how they can integrate with big data Discover the power and potential of blockchain analytics Establish data models and quickly mine for insights and results Create data visualizations from blockchain analysis Discover how blockchains are disrupting the data world with this exciting title in the trusted
line!
Blockchain Data Analytics For Dummies — читать онлайн ознакомительный отрывок
Ниже представлен текст книги, разбитый по страницам. Система сохранения места последней прочитанной страницы, позволяет с удобством читать онлайн бесплатно книгу «Blockchain Data Analytics For Dummies», без необходимости каждый раз заново искать на чём Вы остановились. Поставьте закладку, и сможете в любой момент перейти на страницу, на которой закончили чтение.
Интервал:
Закладка:
Classifying entities
An entity is any object that your data describes, such as a customer, a vendor, a product, an order, or anything else that has characteristics data items can describe. In traditional database terms, an entity would correspond to a record or a row. The concept of a row maps to a spreadsheet concept as well. Think of a spreadsheet of customers. Each row would contain all the data that describes a single customer. Figure 1-1 shows a collection of customers in a table format.
 These customers are stored in a comma-separated value (CSV) text file named
 customer.csv, and displayed in Visual Studio Code using the Edit as CSV extension. To learn more about Visual Studio Code and its extensions, see Chapter 4.
Note that each customer has a set of characteristics, such as name, address, and contact, stored in separate columns. Data analytics models use these different characteristics, also called features, to examine how different entities are related.
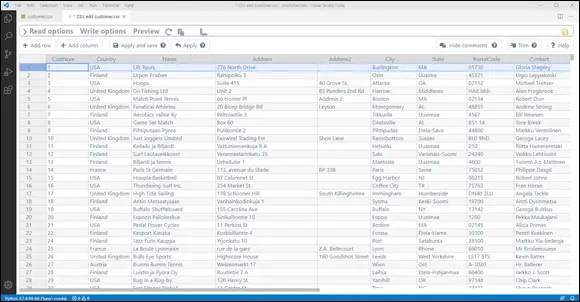
FIGURE 1-1:Customer entities presented as a table.
One type of analysis is to examine the features of different entities to see if some features can help group entities or imply some relationship. For example, suppose you asked a group of people to name their favorite baseball team. You would expect that most people who answered “the Colorado Rockies” most likely live near Colorado. However, you can’t always make such simple associations. If you asked the same question in the 1990s, not everyone who answered “the Atlanta Braves” lived in Georgia. During the 1990s, cable TV was becoming popular and Turner Broadcasting System, whose owner also owned the Braves, broadcast all Braves games nationally. Many people who didn’t live in Georgia became Braves fans.
The Braves example shows that analytics models cannot be trusted unconditionally. Data analytics can provide tremendous value but also requires care and diligence to build models that return results that hold true over time.
Assuming that you invest sufficiently to build good models, classification models can help to identify entities that are similar. Similarity information helps organizations develop targeted marketing campaigns and services to give customers and partners the sense of being treated individually. You learn about several classification models in Chapter 7and build a few in Chapter 10.
Predicting behavior
Although the capability to classify entities to identify groups of similarity can be valuable, analytics can also make predictions. Past behavior is a strong indication of future behavior. Humans tend to repeat actions and decisions, so you can use models that identify patterns to predict future actions. The capability to predict future actions can have tremendous value to organizations. If an organization can determine items that tend to be purchased together frequently, it can use that information to make additional purchase suggestions.
You’ve undoubtedly seen frequent item analysis results when you shop online. When your favorite website recommends that you purchase an additional item, and that item makes sense, it's because other people have bought that same item set in the past. How does the website know that? It used analytics.
One of the common analytics models you learn about in Chapter 7and build in Chapter 11is regression. Don’t worry about the name right now (or the math). Regression is kind of like calculating the slope of a line on steroids. A regression model basically examines your data and figures out a line (or a curve) that matches the data you’ve seen. After you can graph your data, you can use that graph to guess what will happen based on new input data.
Let’s see how that can help. Figure 1-2 shows a linear regression model built on audition data and resulting score data. This example comes from an example you use to build this model in Chapter 11.
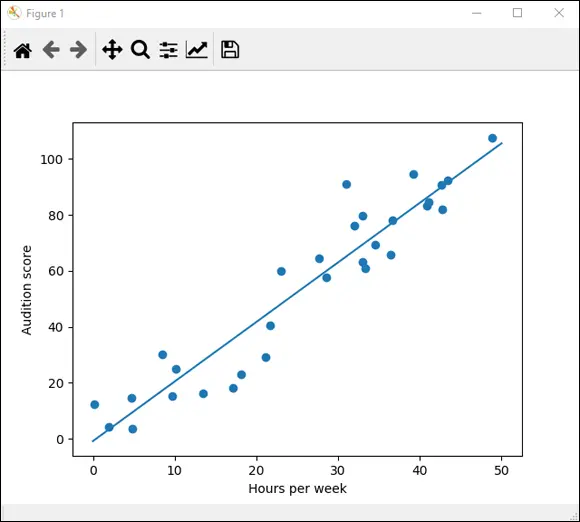
FIGURE 1-2:Linear regression model using hours practiced and audition scores data.
Here’s the explanation you see again in Chapter 11: Suppose you're helping student musicians prepare for honor band tryouts. You've collected historical data on how many hours a week each student practiced, whether the student was accepted in the honor band, and what audition score each student earned. As you would expect, a linear correlation exists between hours of practice and audition score: The more a student practiced each week, the better score that student earned at his or her audition. A linear regression model can predict any student’s audition score if you know how many hours that student practices each week. If you have a student who practices 30 hours per week, you could expect that student to earn a score of about 60 on the audition.
Regression models can help to accurately predict future actions. Using data to know what’s next can be worth its weight in gold when making business decisions. (Yeah, I know data doesn’t have weight, but you get the point.)
Making decisions based on models
Analytics models can help organizations make astounding decisions and gain lots of money. They can also lead organizations to make dumb decisions and lose lots of money. The trick is in knowing how good your models are.
This book is about building analytics models using blockchain data. You learn about blockchain technology and data in Chapters 2and 3, but don’t forget that although the quality of your data is important, building the right model is crucial to getting quality output. Never rely on your first choice of a model or on a single model. Always compare model types and configurations to find the right combination to return the highest quality results.
 If you take only one thing away from this book, I hope that it is to demand measurable verification from every model you build. You should be able to provide metrics for each model indicating its accuracy and that it actually works. Never release a model to your business unit without exhaustive verification. Your organization will use your models to make big decisions. Do your best to give it good tools.
Changing Business Practices to Create Desired Outcomes
Classifying your customers or building models to predict what comes next can help your organization be more responsive to needs. You can use analytics to help plan better and be ready for whatever comes next. But with some additional work, you can do far more with analytics results. Instead of just getting ready for what might happen next, you can use analytics results to alter today’s activities and affect future outcome.
Predictive analytics predicts what future results may be. The next step in analytics maturity is prescriptive analytics. With prescriptive analytics, the model identifies changes you can make now to achieve a desired outcome. For example, prescriptive analytics can tell you how many tables to set out in a restaurant or which register lanes to open in a grocery store to meet sales goals. Prescriptive analytics gives organizations the leverage to make operational changes based on their understanding of data that leads to satisfying their goals.
Читать дальшеИнтервал:
Закладка:
Похожие книги на «Blockchain Data Analytics For Dummies»
Представляем Вашему вниманию похожие книги на «Blockchain Data Analytics For Dummies» списком для выбора. Мы отобрали схожую по названию и смыслу литературу в надежде предоставить читателям больше вариантов отыскать новые, интересные, ещё непрочитанные произведения.


Обсуждение, отзывы о книге «Blockchain Data Analytics For Dummies» и просто собственные мнения читателей. Оставьте ваши комментарии, напишите, что Вы думаете о произведении, его смысле или главных героях. Укажите что конкретно понравилось, а что нет, и почему Вы так считаете.