Engineering Solutions for CO2 Conversion
Здесь есть возможность читать онлайн «Engineering Solutions for CO2 Conversion» — ознакомительный отрывок электронной книги совершенно бесплатно, а после прочтения отрывка купить полную версию. В некоторых случаях можно слушать аудио, скачать через торрент в формате fb2 и присутствует краткое содержание. Жанр: unrecognised, на английском языке. Описание произведения, (предисловие) а так же отзывы посетителей доступны на портале библиотеки ЛибКат.

- Название:Engineering Solutions for CO2 Conversion
- Автор:
- Жанр:
- Год:неизвестен
- ISBN:нет данных
- Рейтинг книги:3 / 5. Голосов: 1
-
Избранное:Добавить в избранное
- Отзывы:
-
Ваша оценка:
Engineering Solutions for CO2 Conversion: краткое содержание, описание и аннотация
Предлагаем к чтению аннотацию, описание, краткое содержание или предисловие (зависит от того, что написал сам автор книги «Engineering Solutions for CO2 Conversion»). Если вы не нашли необходимую информацию о книге — напишите в комментариях, мы постараемся отыскать её.
Engineering Solutions for CO2 Conversion — читать онлайн ознакомительный отрывок
Ниже представлен текст книги, разбитый по страницам. Система сохранения места последней прочитанной страницы, позволяет с удобством читать онлайн бесплатно книгу «Engineering Solutions for CO2 Conversion», без необходимости каждый раз заново искать на чём Вы остановились. Поставьте закладку, и сможете в любой момент перейти на страницу, на которой закончили чтение.
Интервал:
Закладка:
Table 2.3Summary of published CFD studies concerning oxy‐fuel technologies.
| Authors | Aspect studied | Short comment on findings |
|---|---|---|
| Gharebaghi et al. [51] | Single‐phase combustion simulation for a test facility | Comparison between turbulence modeling strategies, i.e. large eddy simulation (LES) and Reynolds averaged Navier–Stokes (RANS), and experimental data |
| Mayr et al. [52] | 3‐D steady‐state simulation of a natural gas furnace including radiation models and the eddy dissipation concept (EDC) model. Effect of O 2/N 2ratios on furnace efficiency | To increase the O 2‐to‐N 2ratio resulted in better furnace efficiency. Good matching between simulated and experimental results |
| Bhuiyan and Naser [50] | Co‐firing biomass + coal using the Eulerian–Lagrangian approach | The authors included factors describing the irregular shape of the biomass particles. The effect of changing the fuel ratio combustion atmosphere in the performance parameters of the furnace |
| Carrasco‐Maldonado et al. [53] | Single‐phase approach to simulate the effect of integrating oxy‐fuel technologies in a cement production plant | Validation against experimental data accomplished. The k – ω turbulence model gave way to the best results |
| Wu et al. [49] | Study of oxy‐fuel combustion in a circulating fluidized bed (CFB). The model uses the Eulerian approach and thus this is a multiphase case that deviates from common oxy‐fuel CFD studies in the literature | Detailed profiles of temperature and hydrodynamic variables are obtained, which match the experimental results. Gas hold‐up is also studied, resulting in identification of gas accumulation spots |
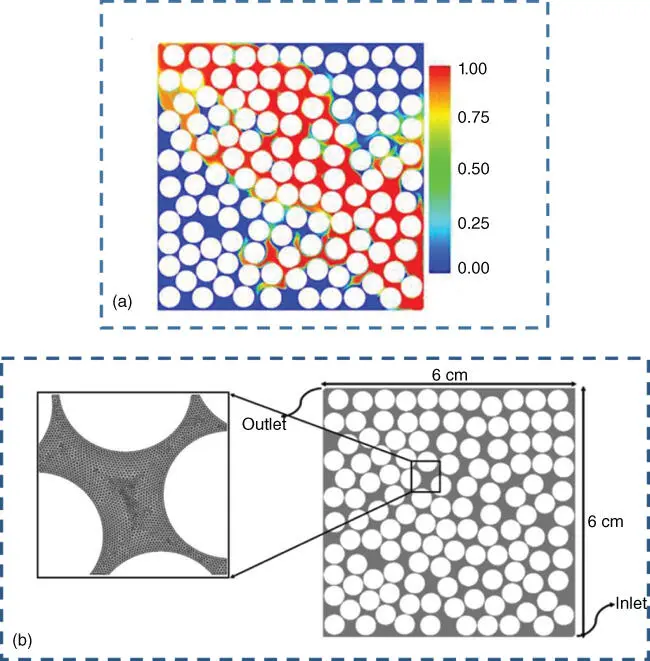
Figure 2.4(a) Details of the volume fraction map describing the liquid flow within the porous medium.
Source: Dezfully et al. [57]. © Trans Tech Publication.
(b) Details of the pore geometry considered.
Source: Gharibshahi et al. [58]. © Elsevier.
The main hurdle to get accurate simulations of CO 2trapping in porous rocks appears to be the correct representation of the intricate geometry of the pore. To overcome this, a recent trend in the simulation of the flow through porous media microchannel networks consists in applying imaging techniques, which are subsequently exported into computer‐aided design (CAD) files and spatially discretized. This approach has been applied in other fields where CFD simulations are of great help to gain insight into the flow within such geometries. For instance, Sznitman et al. point out the possibility of using micro‐computed tomography (μCT) or scanning transmission X‐ray microscopy (STXM) to reproduce the alveoli network within the lungs. Other examples are the use that Owens et al. [23] did of X‐ray computed tomography (CT) to obtain a geometric representation of a structured packing, or the work of Isoz and Haidl [21] also applied to structured packing columns. The use of such imaging techniques to be coupled with VOF‐CFD simulations remains rather unexplored and will surely constitute an important research avenue in the future.
2.6 CFD for Carbon Utilization with Chemical Conversion: The Importance of Numerical Techniques on the Study of New Catalysts
Utilization of carbon dioxide with chemical conversion entails its use as a feedstock in order to transform it into other valuable products such as polymers, fuels, methanol, pharmaceuticals, urea, etc., which otherwise would need to be manufactured by using petrochemicals.
A reaction of particular importance in carbon dioxide utilization with chemical conversion is the Sabatier reaction, whereby CO xis converted to methane by hydrogenation and subsequently introduced into the gas grid:
(2.3) 
CFD simulations of the Sabatier reaction are single phase, which is an advantage from the perspective of the computational resources needed, although they require a multispecies approach and a careful selection of the turbulence model in those cases where the Reynolds number is high. CFD can play an important role in research oriented towards the implementation of different catalysts to accelerate the production of methane. The general approach followed in that case is to obtain experimental data on the reaction kinetics first and introduce them subsequently into the simulation set‐up.
A recent example of the modeling of the Sabatier reaction combined with the water gas shift reaction in a microchannel reactor was presented by Engelbrecht et al. [59], who used the commercial software COMSOL Multiphysics to perform their simulations. They assumed equally distributed flow within the microreactor, and therefore, only one microchannel was considered. To successfully model the process, the computational domain was divided in two zones: a free flow region, where the reaction kinetics without the catalyst was defined, and a porous layer, where the modified reaction kinetics was introduced to accommodate the effect of the catalyst. Figure 2.5a–c shows three parity plots between their numerical and experimental results, with fair agreement between them. Figure 2.5d shows a velocity contour plot and indicates the two areas mentioned above (the porous layer marked as a catalyst layer in the plot and the free flow zone at the center), whereas Figure 2.5e displays the computational mesh used. The reaction kinetics published earlier by Ohya et al. [60] were introduced in the software. In their experiments, the catalyst layer was formed using 8.5 wt% Ru–Cs/Al 2O 3. The model was successful in predicting the CO 2conversion percentage as a function of working temperature and pressure, which were compared to the data obtained experimentally.
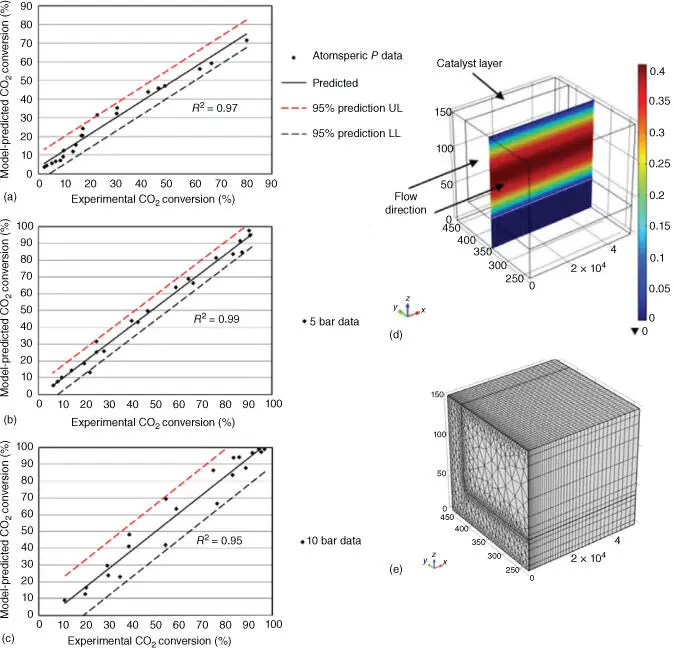
Figure 2.5(a) Parity plot showing the match between the numerical and the experimental results at atmospheric pressure, (b) at 5 bar, and (c) at 10 bar, (d) contours of axial velocity (legend in m s −1) at 250 °C and atmospheric pressure, and (e) image of the computational mesh used to obtain the numerical data.
Source: Engelbrecht et al. [59]. © Elsevier.
Engelbrecht et al. [59] thus used already published data for the reaction kinetics and introduced them on their numerical model, which was subsequently validated by direct comparison with their own experiments in terms of carbon dioxide conversion percentage. The authors not only confirmed their numerical setup as a useful tool, but also confirmed the data of Ohya et al. [60] as an adequate way of describing the reaction kinetics of the methanation reaction in the presence of 8.5 wt% Ru–Cs/Al 2O 3catalyst. The added value of their simulation was therefore to spare the experimental load needed otherwise to obtain the reaction kinetics and on the other hand the insight provided in terms of variable contours and quick parametric sweep possibilities.
A similar methodology was developed by Alarcón et al. [61], who used their own experimental setup to obtain the reaction kinetics and introduced it into the simulation. They developed their model using the commercial software ANSYS Fluent and tested the effect of a catalyst formed with 15 wt% Ni as the active component and ceria as the promoter. Similarly, they only simulated one channel and defined both a free flow and a porous zone where the reaction kinetics were modified in order to account for the presence of the catalyst.
Читать дальшеИнтервал:
Закладка:
Похожие книги на «Engineering Solutions for CO2 Conversion»
Представляем Вашему вниманию похожие книги на «Engineering Solutions for CO2 Conversion» списком для выбора. Мы отобрали схожую по названию и смыслу литературу в надежде предоставить читателям больше вариантов отыскать новые, интересные, ещё непрочитанные произведения.


Обсуждение, отзывы о книге «Engineering Solutions for CO2 Conversion» и просто собственные мнения читателей. Оставьте ваши комментарии, напишите, что Вы думаете о произведении, его смысле или главных героях. Укажите что конкретно понравилось, а что нет, и почему Вы так считаете.