John B. Thompson - Book Wars
Здесь есть возможность читать онлайн «John B. Thompson - Book Wars» — ознакомительный отрывок электронной книги совершенно бесплатно, а после прочтения отрывка купить полную версию. В некоторых случаях можно слушать аудио, скачать через торрент в формате fb2 и присутствует краткое содержание. Жанр: unrecognised, на английском языке. Описание произведения, (предисловие) а так же отзывы посетителей доступны на портале библиотеки ЛибКат.
- Название:Book Wars
- Автор:
- Жанр:
- Год:неизвестен
- ISBN:нет данных
- Рейтинг книги:5 / 5. Голосов: 1
-
Избранное:Добавить в избранное
- Отзывы:
-
Ваша оценка:
Book Wars: краткое содержание, описание и аннотация
Предлагаем к чтению аннотацию, описание, краткое содержание или предисловие (зависит от того, что написал сам автор книги «Book Wars»). Если вы не нашли необходимую информацию о книге — напишите в комментариях, мы постараемся отыскать её.
provides a comprehensive and fine-grained account of technological disruption in one of our most important and successful creative industries.
Like other sectors, publishing has been thrown into disarray by the digital revolution. The foundation on which this industry had been based for 500 years – the packaging and sale of words and images in the form of printed books – was called into question by a technological revolution that enabled symbolic content to be stored, manipulated and transmitted quickly and cheaply. Publishers and retailers found themselves facing a proliferation of new players who were offering new products and services and challenging some of their most deeply held principles and beliefs. The old industry was suddenly thrust into the limelight as bitter conflicts erupted between publishers and new entrants, including powerful new tech giants who saw the world in very different ways. The book wars had begun.
While ebooks were at the heart of many of these conflicts, Thompson argues that the most fundamental consequences lie elsewhere. The print-on-paper book has proven to be a remarkably resilient cultural form, but the digital revolution has transformed the industry in other ways, spawning new players which now wield unprecedented power and giving rise to an array of new publishing forms. Most important of all, it has transformed the broader information and communication environment, creating new challenges and new opportunities for publishers as they seek to redefine their role in the digital age.
This unrivalled account of the book publishing industry as it faces its greatest challenge since Gutenberg will be essential reading for anyone interested in books and their future.
Book Wars — читать онлайн ознакомительный отрывок
Ниже представлен текст книги, разбитый по страницам. Система сохранения места последней прочитанной страницы, позволяет с удобством читать онлайн бесплатно книгу «Book Wars», без необходимости каждый раз заново искать на чём Вы остановились. Поставьте закладку, и сможете в любой момент перейти на страницу, на которой закончили чтение.
Интервал:
Закладка:
Table 1.8UK ebook revenue for trade books, 2008–2018
| Consumer total(£ millions) | Consumer ebook(£ millions) | Ebook% | Rate of growth | |
|---|---|---|---|---|
| 2008 | 1717 | 0.7 | 0 | |
| 2009 | 1684 | 3.1 | 0 | 342.9 |
| 2010 | 1727 | 22.5 | 1.3 | 625.8 |
| 2011 | 1700 | 106.7 | 6.3 | 374.2 |
| 2012 | 1847 | 250 | 13.5 | 134.3 |
| 2013 | 1766 | 296 | 16.8 | 18.4 |
| 2014 | 1709 | 312 | 18.3 | 5.4 |
| 2015 | 1751 | 299 | 17.1 | –4.2 |
| 2016 | 1872 | 276 | 14.7 | –7.7 |
| 2017 | 1912 | 256 | 13.4 | –7.2 |
| 2018 | 1910 | 251 | 13.1 | –2 |
| Source : Publishers Association |
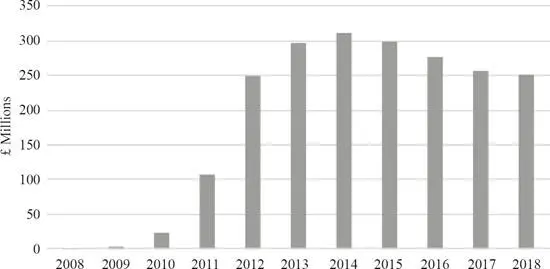
Figure 1.12aUK ebook revenue for trade books, 2008–2018
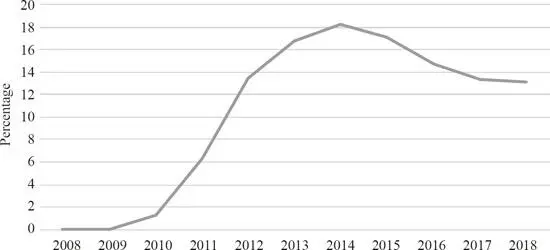
Figure 1.12bEbook revenue as a percentage of total trade sales in the UK
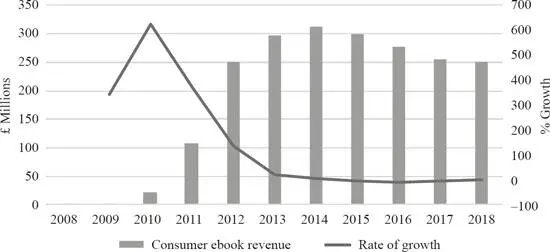
Figure 1.12cEbook revenue and rate of growth of ebook sales in the UK
The PA data breaks out ebook sales by broad categories of books – for our purposes here, the relevant categories are fiction, nonfiction/reference and children’s books. Table 1.9and Figure 1.13show ebook sales as a proportion of total book sales, print plus digital, in each of these three categories. We see that the ebook surge went much further in the area of fiction: here, ebook sales account for just over 40% of total fiction sales in 2014 and 2015 before levelling off. In the nonfiction/reference category, ebook sales rose to 8.4% of total sales in 2014 and then fell back slightly after that. The lowest levels of ebook uptake are in the children’s category, where ebook sales accounted for 7.1% of total sales in 2014 and then fell back to 5% or less from 2016 on. In each of these broad categories, we see the classic S-curve, represented most clearly by fiction, as ebook sales rise rapidly between 2011 and 2013, peak in 2014 and then begin to level off from 2015 on. The pattern is very similar to the US, though time-shifted to around a year later and plateauing at levels that are lower than those achieved in the US.
Table 1.9UK ebook sales by category, 2008–2018
| Fiction£m | Non-fiction/ reference£m | Children’s£m | TOTAL FICTION PRINT+ DIGITAL£m | TOTAL NF/REF PRINT+DIGITAL£m | TOTAL CHILDREN’S PRINT+DIGITAL£m | Fictione/total% | NF/Refe/total% | Children’se/total% | |
|---|---|---|---|---|---|---|---|---|---|
| 2008 | 2.8 | 1.6 | 0.1 | 524.8 | 868.9 | 323.0 | 0.6 | 0.2 | 0.0 |
| 2009 | 7.6 | 1.8 | 0.5 | 568.9 | 781.7 | 333.7 | 1.3 | 0.2 | 0.1 |
| 2010 | 22.0 | 8.0 | 1.8 | 570.5 | 823.6 | 332.8 | 3.9 | 1.0 | 0.5 |
| 2011 | 85.0 | 25.0 | 9.0 | 576.7 | 807.6 | 315.9 | 14.7 | 3.1 | 2.8 |
| 2012 | 205.0 | 47.0 | 14.4 | 710.1 | 814.2 | 324.0 | 28.9 | 5.8 | 4.4 |
| 2013 | 233.0 | 64.0 | 18.5 | 632.7 | 817.0 | 316.3 | 36.8 | 7.8 | 5.8 |
| 2014 | 248.0 | 63.0 | 25.0 | 611.5 | 745.6 | 353.0 | 40.6 | 8.4 | 7.1 |
| 2015 | 249.0 | 63.0 | 19.0 | 616.1 | 817.9 | 317.8 | 40.4 | 7.7 | 6.0 |
| 2016 | 234.0 | 65.0 | 18.0 | 593.7 | 908.3 | 370.0 | 39.4 | 7.2 | 5.0 |
| 2017 | 220.0 | 69.0 | 18.0 | 605.9 | 946.7 | 358.7 | 36.3 | 7.3 | 5.0 |
| 2018 | 229.0 | 75.0 | 17.0 | 588.0 | 953.8 | 368.4 | 38.9 | 7.9 | 4.6 |
| Source : Publishers Association |
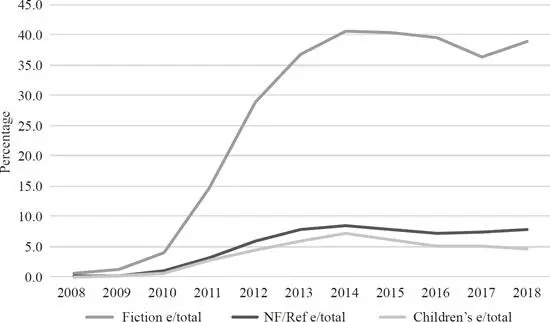
Figure 1.13UK ebook sales as a percentage of total sales by category, 2008–2018
Beyond the US and the UK, the take-up of ebooks has been much more modest to date. It is difficult to gather accurate data which are strictly comparable to the data for the US and the UK, as the methods used for gathering data vary from one country to another. Rüdiger Wischenbart and his colleagues have produced what is probably the most thorough comparative analysis of ebook market trends, and their analysis is regularly updated in their annual Global eBook report. 16 Table 1.10summarizes some of their findings, showing ebooks as a percentage of the total trade market in five European countries. The findings of Wischenbart and his colleagues suggest that ebooks account for around 5% of trade sales in many European countries, although overall percentages of this kind conceal a great deal of variation between different kinds of books and between different publishing houses. As in the US and the UK, the highest percentages for ebook sales are found in general fiction and in genre fiction, such as romance, mystery, sci-fi and fantasy.
Table 1.10Estimated ebook share of total trade revenue in selected European markets, 2016
| % of total trade market | |
|---|---|
| Germany | 4.6 |
| France | 3.1 |
| Italy | 4 |
| Spain | 6 |
| Netherlands | 6.6 |
| Source : Global eBook 2017 |
There is also some evidence to suggest that ebook growth is slowing down in some non-English markets and may be plateauing, though at significantly lower levels than in the US and the UK. Figure 1.14shows ebooks as a percentage of total sales in the trade market in Germany between 2010 and 2016. 17This shows that ebooks took off in Germany after 2011, rising from less than 1% in 2011 to around 4% in 2013; ebooks then levelled off, rising to only 4.6% by 2016. Some publishers surveyed in 2013 by the German book trade association, the Börsenverein des Deutschen Buchhandels, reported higher ebook sales, closer to 10% of overall revenue, but in any case the figure remained well below the percentage reached in the US and the UK before ebook sales began to level off. 18By the end of 2015, all German trade publishers had found that ebook sales were largely flat.
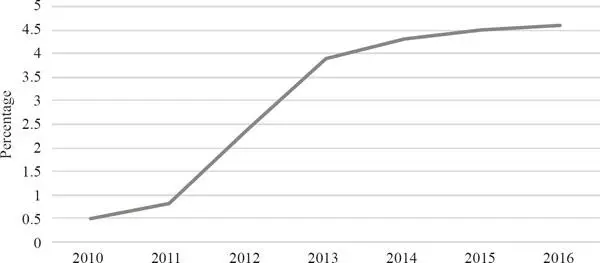
Figure 1.14Ebooks as a percentage of total trade sales in Germany, 2010–2016
Source : Börsenverein
Patterns in other parts of the world are difficult to compare, partly because the bases on which data is gathered may be different and partly because the infrastructures and markets are often very different. In Brazil, for example, digital sales probably accounted for around 3% of trade publishers’ revenue in 2016. 19For other large markets, such as India and China, it’s hard to get reliable and comparable data. Wischenbart and his colleagues estimate that ebook sales in India were less than 1% of total sales in 2015, 20and estimate that ebook sales for trade books in China were around 1% in 2014, 21though it’s impossible to know how accurate these estimates are. The most common reading devices in China are smartphones rather than dedicated reading devices, and China Mobile, one of two major telecom providers in China, owns the largest online mobile reading platform. With over 700 million smartphone users in China by 2018 and with the second-largest book market in the world after the US, the potential for the growth of digital reading in China is considerable, even if ebook sales to date have been modest.
Читать дальшеИнтервал:
Закладка:
Похожие книги на «Book Wars»
Представляем Вашему вниманию похожие книги на «Book Wars» списком для выбора. Мы отобрали схожую по названию и смыслу литературу в надежде предоставить читателям больше вариантов отыскать новые, интересные, ещё непрочитанные произведения.


Обсуждение, отзывы о книге «Book Wars» и просто собственные мнения читателей. Оставьте ваши комментарии, напишите, что Вы думаете о произведении, его смысле или главных героях. Укажите что конкретно понравилось, а что нет, и почему Вы так считаете.