John B. Thompson - Book Wars
Здесь есть возможность читать онлайн «John B. Thompson - Book Wars» — ознакомительный отрывок электронной книги совершенно бесплатно, а после прочтения отрывка купить полную версию. В некоторых случаях можно слушать аудио, скачать через торрент в формате fb2 и присутствует краткое содержание. Жанр: unrecognised, на английском языке. Описание произведения, (предисловие) а так же отзывы посетителей доступны на портале библиотеки ЛибКат.
- Название:Book Wars
- Автор:
- Жанр:
- Год:неизвестен
- ISBN:нет данных
- Рейтинг книги:5 / 5. Голосов: 1
-
Избранное:Добавить в избранное
- Отзывы:
-
Ваша оценка:
Book Wars: краткое содержание, описание и аннотация
Предлагаем к чтению аннотацию, описание, краткое содержание или предисловие (зависит от того, что написал сам автор книги «Book Wars»). Если вы не нашли необходимую информацию о книге — напишите в комментариях, мы постараемся отыскать её.
provides a comprehensive and fine-grained account of technological disruption in one of our most important and successful creative industries.
Like other sectors, publishing has been thrown into disarray by the digital revolution. The foundation on which this industry had been based for 500 years – the packaging and sale of words and images in the form of printed books – was called into question by a technological revolution that enabled symbolic content to be stored, manipulated and transmitted quickly and cheaply. Publishers and retailers found themselves facing a proliferation of new players who were offering new products and services and challenging some of their most deeply held principles and beliefs. The old industry was suddenly thrust into the limelight as bitter conflicts erupted between publishers and new entrants, including powerful new tech giants who saw the world in very different ways. The book wars had begun.
While ebooks were at the heart of many of these conflicts, Thompson argues that the most fundamental consequences lie elsewhere. The print-on-paper book has proven to be a remarkably resilient cultural form, but the digital revolution has transformed the industry in other ways, spawning new players which now wield unprecedented power and giving rise to an array of new publishing forms. Most important of all, it has transformed the broader information and communication environment, creating new challenges and new opportunities for publishers as they seek to redefine their role in the digital age.
This unrivalled account of the book publishing industry as it faces its greatest challenge since Gutenberg will be essential reading for anyone interested in books and their future.
Book Wars — читать онлайн ознакомительный отрывок
Ниже представлен текст книги, разбитый по страницам. Система сохранения места последней прочитанной страницы, позволяет с удобством читать онлайн бесплатно книгу «Book Wars», без необходимости каждый раз заново искать на чём Вы остановились. Поставьте закладку, и сможете в любой момент перейти на страницу, на которой закончили чтение.
Интервал:
Закладка:
Table 1.5and figure 1.6ashow all ebooks as a percentage of Olympic’s total sales by both units and revenue. We see that Olympic’s ebook sales were negligible in 2006 and 2007 but they began to grow rapidly from 2008 on, reaching a peak in 2012, when ebook sales accounted for just under 26% of Olympic’s total revenue. From that point on, ebook sales began to decline as a proportion of total sales, falling to below 23% in 2015 and then down to 17% in 2016. The pattern is very similar for both units and revenue, as one would expect. The levelling off in ebook sales is more vividly displayed when we change the scale of the y-axis on the graph, as in figure 1.6b: here, again, we see that the pattern of ebook sales at Olympic displays the classic technology S-curve.
However, looking at all ebooks as a percentage of total sales gives us a very partial view of what has happened because it masks the variations between different categories of books. In the early 2000s, before ebooks began to take off, many commentators assumed that when the ebook revolution began, it would be driven primarily by businessmen who wanted to carry business books with them on their business trips, reading at airports and on planes: it was adult nonfiction, and especially business books and ‘big idea’ books, that would, they thought, spearhead the ebook revolution. Were they right? Is that what actually happened?
Table 1.6and figure 1.7break down ebooks into three broad categories: adult fiction, adult nonfiction and juvenile (where juvenile includes all children’s books as well as young adult). The figure shows ebooks as a percentage of Olympic’s total sales, by both revenue and units, in each of these broad categories. (As with figure 1.6b, the y-axis has been adjusted to display the S-curve.) It is immediately clear that the category where the biggest change has occurred is not nonfiction but, rather, adult fiction: in terms of revenue, ebooks as a percentage of total revenue in adult fiction increased from 1.0% in 2008 to 43.4% in 2014, before falling back to 37.4% in 2015 and then rebounding slightly to 38.9% in 2016. This contrasts sharply with adult nonfiction, where ebooks as a percentage of total revenue rose from 0.4% in 2008 to 16.6% in 2015, before falling back to 13.2% in 2016 – remaining well below 20% throughout this period. Juvenile lagged even further behind: here ebooks as a percentage of total revenue increased from 0.1% in 2008 to 12.2% in 2014, before falling back to 7.4% in 2015 and 6% in 2016. 5Each broad category displays an S-curve but the shape of the curve is different in each case. Adult fiction nearly reaches 45% before it levels off and starts to decline, adult nonfiction levels off at around 15% and, in the case of juvenile, the ebooks peak at around 12% and then fall off. Both adult fiction and juvenile show a sharp downturn in 2015, while adult nonfiction continues to grow very modestly before falling off in 2016.
Table 1.6Ebooks as a percentage of total sales by broad category at Olympic, units and dollars
| Adult Fiction units | Adult Fiction $ | Adult NF units | Adult NF $ | Juv units | Juv $ | |
|---|---|---|---|---|---|---|
| 2006 | 0.2 | 0.1 | 0.1 | 0.1 | 0 | 0 |
| 2007 | 0.2 | 0.2 | 0.1 | 0.1 | 0 | 0 |
| 2008 | 0.9 | 1 | 0.4 | 0.4 | 0.1 | 0.1 |
| 2009 | 4 | 4.7 | 1.5 | 1.8 | 0.2 | 0.4 |
| 2010 | 12.6 | 14.3 | 4.4 | 4.9 | 0.9 | 1.4 |
| 2011 | 29.1 | 30.4 | 12.2 | 12.6 | 3.5 | 5.3 |
| 2012 | 37.2 | 38.2 | 15.9 | 15 | 5 | 8.4 |
| 2013 | 40.9 | 40.2 | 16 | 15.3 | 5.9 | 9.2 |
| 2014 | 42.6 | 43.4 | 16.6 | 15.8 | 7.5 | 12.2 |
| 2015 | 40.6 | 37.4 | 18.2 | 16.6 | 4 | 7.4 |
| 2016 | 35 | 38.9 | 16.4 | 13.2 | 6 | 6 |
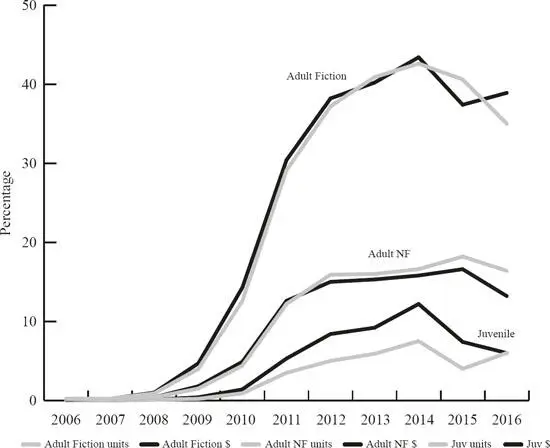
Figure 1.7Ebooks as a percentage of total sales by broad category at Olympic, units and dollars
We are still working with very broad categories, however. Let’s drill down a little further and examine the patterns for different categories of books, using a selected number of standard BISAC subject headings. 6 Figures 1.8and 1.9break down ebooks as a percentage of total sales by subject at Olympic (for the data on which these figures are based, see appendix 1). Figure 1.8is net dollars and Figure 1.9is net units. (Again, the y-axis has been adjusted to display the S-curves.) These graphs vividly display the enormous variation in the uptake of ebooks across different categories of books, and underscore how misleading it is to collapse all of these categories into the single category of ‘ebook’. We see the huge spectrum of trajectories here, with each category of book displaying its own distinctive S-curve. Each S-curve rises in its own unique way and begins to level off at a point and in a manner that is specific to that category. In some cases, the growth plateaus and then stabilizes more or less at that level; in some cases, it plateaus and then begins to decline; in some cases, the growth levels off and declines and then shoots back up; and in other cases, the growth never takes off at all. We also see a lot of movement up and down – the lines jump about, dips are followed by rises and rises are followed by dips as the numbers for each category fluctuate from one year to the next. There’s nothing too surprising about that: these graphs are based on sales figures from one large trade house which has a limited number of books in any one category in any one year, so one or two books selling strongly as ebooks (or other special circumstances, like the disposal or acquisition of an imprint) can produce an ebook spike or dip in that category. The sales figures from one publisher – even a large publisher like Olympic – will display idiosyncrasies of this kind and therefore cannot be taken as a proxy for the industry as a whole. But by focusing on the broad patterns and trends rather than the fluctuations from one year to the next, we can get a good sense of how different categories of books have performed over time.
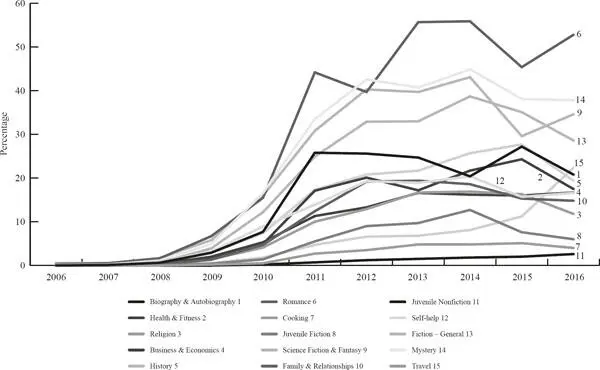
Figure 1.8Ebooks as a percentage of total sales by subject at Olympic, net dollars
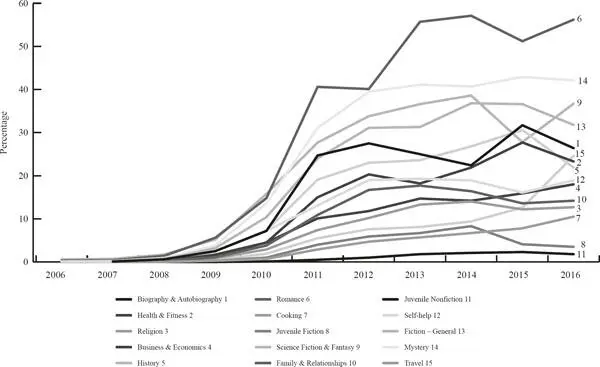
Figure 1.9Ebooks as a percentage of total sales by subject at Olympic, net units
As these data make clear, the top-performing category in terms of ebook uptake is not business books after all, it is romance fiction – this outperforms every other category by a significant margin. Here we see steep growth from 2008 to 2011, by which time ebooks were accounting for 44.2% of all Olympic’s sales of romance books. Ebook sales dipped the following year but then rose again, accounting for around 55% of all romance sales in 2013 and 2014. In 2015 they fell back to 45% but then rebounded in 2016, when they once again amounted to around 53% of all Olympic’s sales of romance books. Of all the different categories of books published by Olympic, romance is the one where ebooks have accounted for the highest proportion of overall sales – more than half – and it’s a category where ebook sales remain high despite the downturn in other categories.
Читать дальшеИнтервал:
Закладка:
Похожие книги на «Book Wars»
Представляем Вашему вниманию похожие книги на «Book Wars» списком для выбора. Мы отобрали схожую по названию и смыслу литературу в надежде предоставить читателям больше вариантов отыскать новые, интересные, ещё непрочитанные произведения.


Обсуждение, отзывы о книге «Book Wars» и просто собственные мнения читателей. Оставьте ваши комментарии, напишите, что Вы думаете о произведении, его смысле или главных героях. Укажите что конкретно понравилось, а что нет, и почему Вы так считаете.