John B. Thompson - Book Wars
Здесь есть возможность читать онлайн «John B. Thompson - Book Wars» — ознакомительный отрывок электронной книги совершенно бесплатно, а после прочтения отрывка купить полную версию. В некоторых случаях можно слушать аудио, скачать через торрент в формате fb2 и присутствует краткое содержание. Жанр: unrecognised, на английском языке. Описание произведения, (предисловие) а так же отзывы посетителей доступны на портале библиотеки ЛибКат.
- Название:Book Wars
- Автор:
- Жанр:
- Год:неизвестен
- ISBN:нет данных
- Рейтинг книги:5 / 5. Голосов: 1
-
Избранное:Добавить в избранное
- Отзывы:
-
Ваша оценка:
Book Wars: краткое содержание, описание и аннотация
Предлагаем к чтению аннотацию, описание, краткое содержание или предисловие (зависит от того, что написал сам автор книги «Book Wars»). Если вы не нашли необходимую информацию о книге — напишите в комментариях, мы постараемся отыскать её.
provides a comprehensive and fine-grained account of technological disruption in one of our most important and successful creative industries.
Like other sectors, publishing has been thrown into disarray by the digital revolution. The foundation on which this industry had been based for 500 years – the packaging and sale of words and images in the form of printed books – was called into question by a technological revolution that enabled symbolic content to be stored, manipulated and transmitted quickly and cheaply. Publishers and retailers found themselves facing a proliferation of new players who were offering new products and services and challenging some of their most deeply held principles and beliefs. The old industry was suddenly thrust into the limelight as bitter conflicts erupted between publishers and new entrants, including powerful new tech giants who saw the world in very different ways. The book wars had begun.
While ebooks were at the heart of many of these conflicts, Thompson argues that the most fundamental consequences lie elsewhere. The print-on-paper book has proven to be a remarkably resilient cultural form, but the digital revolution has transformed the industry in other ways, spawning new players which now wield unprecedented power and giving rise to an array of new publishing forms. Most important of all, it has transformed the broader information and communication environment, creating new challenges and new opportunities for publishers as they seek to redefine their role in the digital age.
This unrivalled account of the book publishing industry as it faces its greatest challenge since Gutenberg will be essential reading for anyone interested in books and their future.
Book Wars — читать онлайн ознакомительный отрывок
Ниже представлен текст книги, разбитый по страницам. Система сохранения места последней прочитанной страницы, позволяет с удобством читать онлайн бесплатно книгу «Book Wars», без необходимости каждый раз заново искать на чём Вы остановились. Поставьте закладку, и сможете в любой момент перейти на страницу, на которой закончили чтение.
Интервал:
Закладка:
Table 1.2 Ebook sales as a percentage of total revenues of major US trade publishers, 2006–2012
| 2006 | 0.1 |
| 2007 | 0.5 |
| 2008 | 1.1 |
| 2009 | 2.9 |
| 2010 | 7.6 |
| 2011 | 17.3 |
| 2012 | 23.2 |
| Source : Association of American Publishers |
Table 1.3US ebook revenue for trade books and rate of growth of ebook sales, 2008–2018
| Revenue ($ millions) | Rate of growth (%) | |
|---|---|---|
| 2008 | 69.1 | |
| 2009 | 187.9 | 171.9 |
| 2010 | 502.7 | 167.5 |
| 2011 | 1095.1 | 117.8 |
| 2012 | 1543.6 | 41 |
| 2013 | 1510.9 | –2.1 |
| 2014 | 1601.1 | 6 |
| 2015 | 1360.5 | –15 |
| 2016 | 1157.7 | –15 |
| 2017 | 1054.3 | –8.9 |
| 2018 | 1016.1 | –3.6 |
| Source : Association of American Publishers |
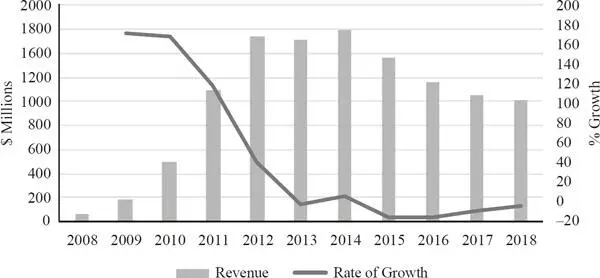
Figure 1.3US ebook revenue for trade books and rate of growth of ebook sales, 2008–2018
Source : Association of American Publishers
If we then look at print books and ebooks as percentages of total sales ( table 1.4and figure 1.4), we can see that ebooks level off at 23–24% in 2012, 2013 and 2014 and then begin to decline, falling to around 15% in 2017 and 2018. Print books, on the other hand, continue to account for the lion’s share of sales, falling to around 75% of total sales in 2012, 2013 and 2014 but then rebounding, rising to between 80 and 85% from 2015 to 2018.
Table 1.4Print books and ebooks as percentages of total US trade sales
| Print books | Ebooks | |
|---|---|---|
| 2008 | 98.9 | 1.1 |
| 2009 | 97.1 | 2.9 |
| 2010 | 92.4 | 7.6 |
| 2011 | 82.7 | 17.3 |
| 2012 | 76.8 | 23.2 |
| 2013 | 76.6 | 23.4 |
| 2014 | 75.9 | 24.1 |
| 2015 | 79.3 | 20.7 |
| 2016 | 83.2 | 16.8 |
| 2017 | 84.3 | 15.7 |
| 2018 | 85.3 | 14.7 |
| Source : Association of American Publishers |
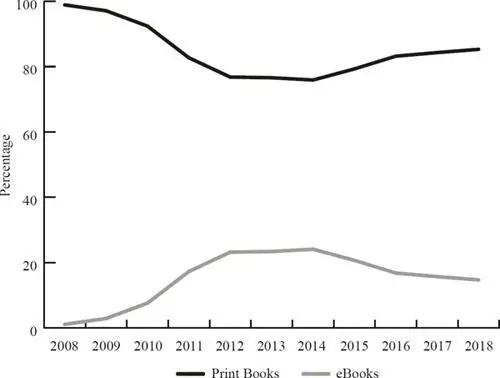
Figure 1.4Print books and ebooks as percentages of total US trade sales
Source : Association of American Publishers
And if we then extract the ebook percentages and reformat the vertical scale of this graph ( figure 1.5), we can see that the growth of ebooks during this period displays the pattern of the classic technology S-curve: adoption is slow at the beginning, it then takes off and grows rapidly when there is a breakthrough of some kind, and then levels off when the market has been saturated or the limits of performance have been reached. In some cases, the S-curve may decline after this point as the technology no longer improves, alternative technologies appear that steal market share, novelty fades or demand wanes for other reasons. In the case of ebooks, the take-off occurred in 2008–9, following the introduction of the Kindle, and sales rose steeply until 2012 when they levelled off and then fell back.
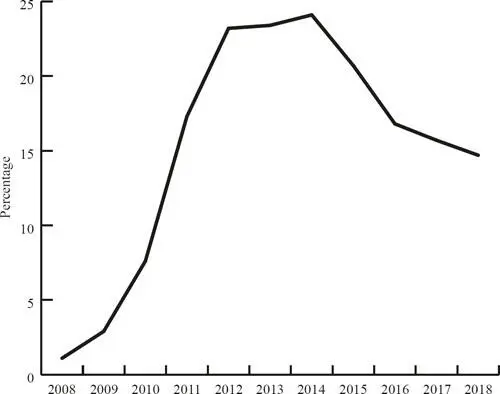
Figure 1.5Ebooks as percentage of total US trade sales, 2008–2018
Source : Association of American Publishers
Of course, this does not mean that ebook sales in US trade publishing will remain at around 15 per cent in the future, or will continue to decline, or will never rise above this level – we simply don’t know what will happen in the future. But, with the benefit of hindsight, we can now see that the dramatic growth that followed the introduction of the Kindle in November 2007 was short-lived, and it came to an abrupt halt in 2012. While the future is unpredictable, it would be a bold soul who, knowing what we now know, suggested that mainstream trade publishers were likely to experience a strong resurgence of ebook sales in the near future – the numbers could fluctuate from year to year, affected by various factors, but, given the evidence to date, a strong and sustained resurgence seems unlikely.
The differentiated pattern of ebook sales: delving beneath the surface
The issues are more complicated than they appear at first sight, however. While the S-curve gives a neat picture of the overall trend, it is misleading because it collapses all the different kinds of books into one average number. We shouldn’t assume that different kinds of books perform in the same way – they don’t. The extent to which books have migrated from print to digital formats has varied enormously from one kind of book to another. We can see this by looking at some sales data from a large US trade publisher that I’ll call ‘Olympic’. Table 1.5and figures 1.6aand 1.6bgive a breakdown of ebook sales as a percentage of total sales at Olympic from 2006 to 2016. All data are based on net units and net sales – that is, sales net of any returns. We should not assume that these data are representative of the industry as a whole, or that the experiences of all trade publishers will have been identical to this one – the data from each publishing house will be unique and will reflect to some extent the specific titles they’ve published. But Olympic is a mainstream trade publisher with a large and varied list, and the occasional truly exceptional title has been stripped out of the data to minimize the distorting effect of outliers. So while the experiences of each publisher will be unique, it is unlikely that the sales patterns of other major trade houses will differ radically from the patterns experienced by Olympic.
Table 1.5Ebooks as a percentage of total sales at Olympic, units and dollars
| Ebooks units | Ebooks $ | |
|---|---|---|
| 2006 | 0.1 | 0.1 |
| 2007 | 0.1 | 0.1 |
| 2008 | 0.5 | 0.5 |
| 2009 | 1.9 | 2.6 |
| 2010 | 6.2 | 8.6 |
| 2011 | 16.4 | 19.5 |
| 2012 | 22.2 | 25.9 |
| 2013 | 20.7 | 23.8 |
| 2014 | 19.8 | 23.7 |
| 2015 | 19.7 | 22.6 |
| 2016 | 16.4 | 17.1 |
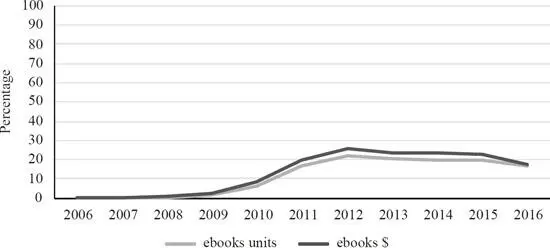
Figure 1.6aEbooks as a percentage of total sales at Olympic, units and dollars
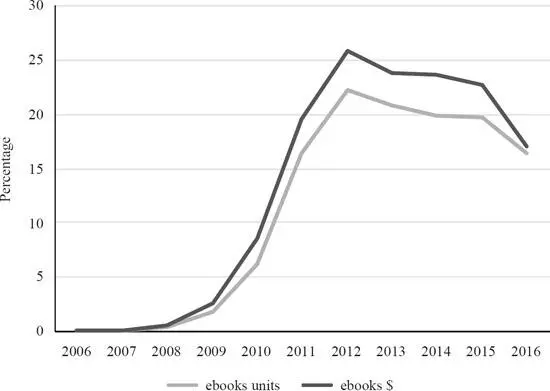
Figure 1.6bEbooks as a percentage of total sales at Olympic, units and dollars
There is another important qualification to make about these data: they are for the period 2006–16 only and we cannot extrapolate, on the basis of these data, to the sales patterns for 2017 and subsequent years. Future patterns could change. I’ll return to this issue below. But, for now, let’s focus on what actually happened in the crucial decade from 2006 to 2016.
Читать дальшеИнтервал:
Закладка:
Похожие книги на «Book Wars»
Представляем Вашему вниманию похожие книги на «Book Wars» списком для выбора. Мы отобрали схожую по названию и смыслу литературу в надежде предоставить читателям больше вариантов отыскать новые, интересные, ещё непрочитанные произведения.


Обсуждение, отзывы о книге «Book Wars» и просто собственные мнения читателей. Оставьте ваши комментарии, напишите, что Вы думаете о произведении, его смысле или главных героях. Укажите что конкретно понравилось, а что нет, и почему Вы так считаете.