Malcolm L. Hunter - Fundamentals of Conservation Biology
Здесь есть возможность читать онлайн «Malcolm L. Hunter - Fundamentals of Conservation Biology» — ознакомительный отрывок электронной книги совершенно бесплатно, а после прочтения отрывка купить полную версию. В некоторых случаях можно слушать аудио, скачать через торрент в формате fb2 и присутствует краткое содержание. Жанр: unrecognised, на английском языке. Описание произведения, (предисловие) а так же отзывы посетителей доступны на портале библиотеки ЛибКат.
- Название:Fundamentals of Conservation Biology
- Автор:
- Жанр:
- Год:неизвестен
- ISBN:нет данных
- Рейтинг книги:3 / 5. Голосов: 1
-
Избранное:Добавить в избранное
- Отзывы:
-
Ваша оценка:
Fundamentals of Conservation Biology: краткое содержание, описание и аннотация
Предлагаем к чтению аннотацию, описание, краткое содержание или предисловие (зависит от того, что написал сам автор книги «Fundamentals of Conservation Biology»). Если вы не нашли необходимую информацию о книге — напишите в комментариях, мы постараемся отыскать её.
has been a valued mainstay of the literature, serving both to introduce new students to this ever-changing topic, and to provide an essential resource for academics and researchers working in the discipline. In the decade since the publication of the third edition, concerns about humanity’s efforts to conserve the natural world have only grown deeper, as new threats to biodiversity continue to emerge.
This fourth edition has taken into account a vast new literature, and boasts nearly a thousand new references as a result. By embracing new theory and practice and documenting many examples of both conservation successes and the hard lessons of real-world “wicked” environmental problems,
remains a vital resource for biologists, conservationists, ecologists, environmentalists, and others.
Fundamentals of Conservation Biology — читать онлайн ознакомительный отрывок
Ниже представлен текст книги, разбитый по страницам. Система сохранения места последней прочитанной страницы, позволяет с удобством читать онлайн бесплатно книгу «Fundamentals of Conservation Biology», без необходимости каждый раз заново искать на чём Вы остановились. Поставьте закладку, и сможете в любой момент перейти на страницу, на которой закончили чтение.
Интервал:
Закладка:
Within populations of most wild species, different individuals can look quite similar, but they are still genetically distinct to some degree from all other individuals. The gray squirrel, familiar to many in North America where it is native and in the UK, Italy, France, and South Africa where it is introduced, is a good example. Individuals occur in two strikingly distinct forms (all gray or all black) that differ only in the composition of a single gene that codes for coat color (McRobie et al. 2009) ( Fig. 5.3). Females can produce offspring of either color. Individuals of the dark morph are more conspicuous to hunters so they tend not to survive well (Creed and Sharp 1958) except in cities where hunting does not occur.
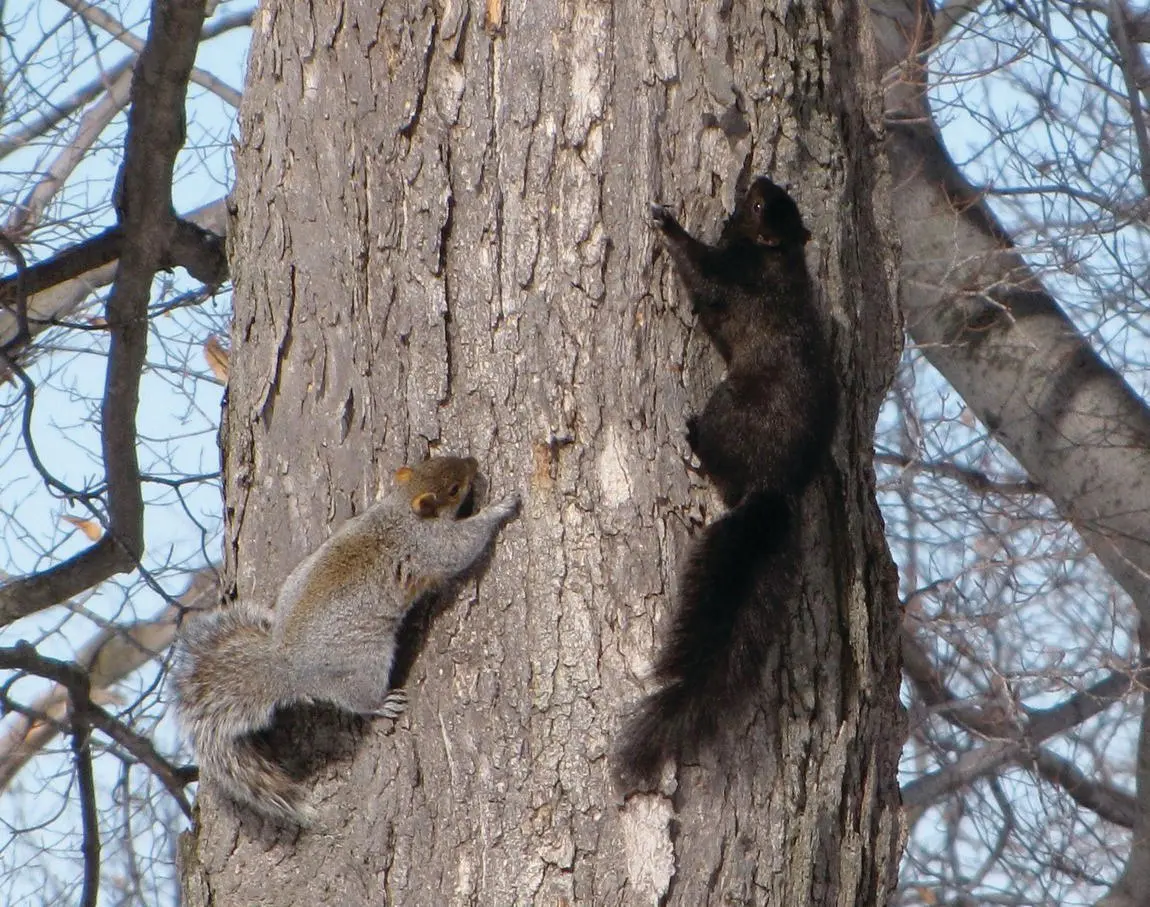
Figure 5.3 Two morphs of the eastern gray squirrel well known from the eastern United States. The two morphs differ by a difference in a single gene that promotes production of melanin during hair production yet have very different survival consequences as a result. The darker morph once blended well into the old‐growth forests that dominated the landscape, but now stands out against the less mature forests regenerated after widespread forest destruction following European colonization. The result has been to make the darker morph more conspicuous to hunters, and less widespread, except in urban areas where hunting is prohibited.
(James P. Gibbs, author)
In sum, wherever there are two alleles for the same gene or, to state it more explicitly, different configurations of DNA occupying the same locus (gene) on a chromosome, genetic variation occurs within an individual and is also expressed as variation among individuals. This variation is the “grist” for biological evolution – without it evolution would grind to a halt. Ultimately the diversity of all life on the planet is rooted in how genetic differences among individuals are slowly shaped by evolution into different lineages and ultimately expressed as differences among populations, species, and eventually at higher taxonomic levels. For these reasons, differences in the distributions of alleles are the foundation of measuring genetic diversity. (For details on how genetic diversity arises through processes such as mutation and natural selection, see Hartl 2000; Frankham et al. 2009; Allendorf et al. 2013.)
Measuring Genetic Diversity
There are many methods to determine qualitative variation among individuals and populations in the types of alleles present at a given locus. An older but still used, indirect technique, called protein electrophoresis, involves extracting a “soup” of all the enzymes present when tissues of an individual (e.g. a leaf sample, skin clip) are crushed and their cell contents released. A sample of this soup is placed into a gel made of starch and water and subjected to an electrical field. Different alleles for particular genes produce different variations of enzymes called allozymes that move at different rates based on slight changes in their protein structure that alter their electrical charges. By probing the gel with dyes that express only when they encounter a particular allozyme, you can see with your own eyes genetic variation at the molecular level based on how slowly or quickly different proteins with different electrical charges move down the gel.
More modern methods snip DNA into fragments and then separate and characterize these fragments using electrophoresis. Different alleles produce different fragment lengths. These methods are described briefly in Hartl (2000), and, more completely, in Barnes and Breen (2010). A more direct method, called DNA sequencing, involves determining the sequence of adenine, thymine, cytosine, and guanine along particular stretches of DNA of interest. This is now a widespread, more exacting technique used to measure genetic diversity. Sequencing is now increasingly done at the level of entire genomes , that is, the complete set of DNA within a single cell of an organism, instead of just particular genes or gene products (allozymes). This is the essence of the new field of genomics that is transforming the measurement of genetic diversity. Genome‐wide sequencing provides the ultimate degree of genetic resolution. With it we can understand not only how the genome is organized (its “structure”) but what all its parts actually “do” (what gene codes for what trait) and how they work together (its “function”). Genome‐level investigations have yielded surprising results; for example, we have learned that humans are not the epitome of genetic sophistication, and that the genome of the humble Mexican axolotl is made up of 32 billion base pairs, 10 times more than the human genome (Nowoshilow et al. 2018). This creates another challenge, however: making sense of the vast amount of data generated by genome‐wide sequencing – a daunting task. Doing so is the main focus of the rapidly expanding field of bioinformatics enabled by high‐speed computers. Together genomics and bioinformatics are transforming our understanding of the genetic basis for how organisms functions and ultimately how differences among individuals are manifested as distinct populations, species, and higher taxa like families. A practical example of the application of genomics to endangered species conservation is elucidation of the most important genetic vulnerabilities of endangered populations of island foxes and prioritization of management actions to address them (Funk et al. 2016).
Despite the promise of genomics, sequencing entire genomes is still quite laborious and costly. Therefore, until genomic analysis becomes more routine, a small sample of genes is still typically selected for measurement of genetic diversity and identity. We assume the pattern this subset of genes shows is reflective of the entire genome. Similarly, it is usually not possible to test all the individuals in a population; thus, a sample of individuals is used. After the allelic distribution for a sample of genes from a sample of individuals has been determined, an index to describe these distributions quantitatively can be calculated. Conservation biologists are most interested in indices of two important genetic properties of populations – polymorphism and heterogeneity – to quantify genetic diversity and guide conservation decision‐making.
Polymorphism
Polymorphism (usually abbreviated P) is defined as the proportion or percentage of genes that are polymorphic. A gene is considered polymorphic if the frequency of the most common allele is less than a defined threshold (usually 95%, Hartl and Clark 1997); otherwise it is monomorphic, that is, lacking in variation. This definition is easier to explain with numbers than with words; we will use data collected from five American bison sampled from the descendants of bison that were moved to Badlands National Park as part of a reintroduction program (McClenaghan et al. 1990). The allelic distributions for 24 different genes were determined using electrophoresis of blood proteins, and only one gene was polymorphic. That is, for the other 23 genes sampled, a single allele accounted for at least 95% of the samples. The polymorphic gene was called malate dehydrogenase‐1 (abbreviated MDH‐1) for the enzyme it encoded. MDH‐1 had two different alleles that we will call X and Y . Among the five bison, two individuals (A and B) were heterozygous (X/Y), two individuals (C and D) were homozygous for the Y allele (Y/Y), and one (E) was homozygous for the X allele (X/X) ( Table 5.1). In this case Y was the most common allele; its frequency was 0.6 or 60% (i.e. 6 of the 10 alleles were Y ), and the frequency of the X allele was 0.4. Because the frequency of the most common allele, Y , was 60% and so less than 95%, the MDH‐1 gene was considered polymorphic. Because out of the 24 genes sampled, only MDH‐1 was polymorphic, the estimated polymorphism was 1 divided by 24 or 0.042 or 4.2%.
Читать дальшеИнтервал:
Закладка:
Похожие книги на «Fundamentals of Conservation Biology»
Представляем Вашему вниманию похожие книги на «Fundamentals of Conservation Biology» списком для выбора. Мы отобрали схожую по названию и смыслу литературу в надежде предоставить читателям больше вариантов отыскать новые, интересные, ещё непрочитанные произведения.


Обсуждение, отзывы о книге «Fundamentals of Conservation Biology» и просто собственные мнения читателей. Оставьте ваши комментарии, напишите, что Вы думаете о произведении, его смысле или главных героях. Укажите что конкретно понравилось, а что нет, и почему Вы так считаете.