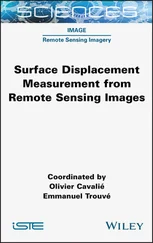
Jakob J. Zyl - Introduction to the Physics and Techniques of Remote Sensing

Здесь есть возможность читать онлайн «Jakob J. Zyl - Introduction to the Physics and Techniques of Remote Sensing» — ознакомительный отрывок электронной книги совершенно бесплатно, а после прочтения отрывка купить полную версию. В некоторых случаях можно слушать аудио, скачать через торрент в формате fb2 и присутствует краткое содержание. Жанр: unrecognised, на английском языке. Описание произведения, (предисловие) а так же отзывы посетителей доступны на портале библиотеки ЛибКат.

Introduction to the Physics and Techniques of Remote Sensing: краткое содержание, описание и аннотация

Предлагаем к чтению аннотацию, описание, краткое содержание или предисловие (зависит от того, что написал сам автор книги «Introduction to the Physics and Techniques of Remote Sensing»). Если вы не нашли необходимую информацию о книге — напишите в комментариях, мы постараемся отыскать её.

Discover cutting edge theory and applications of modern remote sensing in geology, oceanography, atmospheric science, ionospheric studies, and more  The thoroughly revised third edition of the 
delivers a comprehensive update to the authoritative textbook, offering readers new sections on radar interferometry, radar stereo, and planetary radar. It explores new techniques in imaging spectroscopy and large optics used in Earth orbiting, planetary, and astrophysics missions. It also describes remote sensing instruments on, as well as data acquired with, the most recent Earth and space missions. 
Readers will benefit from the brand new and up-to-date concept examples and full-color photography, 50% of which is new to the series. You’ll learn about the basic physics of wave/matter interactions, techniques of remote sensing across the electromagnetic spectrum (from ultraviolet to microwave), and the concepts behind the remote sensing techniques used today and those planned for the future. 
The book also discusses the applications of remote sensing for a wide variety of earth and planetary atmosphere and surface sciences, like geology, oceanography, resource observation, atmospheric sciences, and ionospheric studies. This new edition also incorporates: 
A fulsome introduction to the nature and properties of electromagnetic waves An exploration of sensing solid surfaces in the visible and near infrared spectrums, as well as thermal infrared, microwave, and radio frequencies A treatment of ocean surface sensing, including ocean surface imaging and the mapping of ocean topography A discussion of the basic principles of atmospheric sensing and radiative transfer, including the radiative transfer equation Perfect for senior undergraduate and graduate students in the field of remote sensing instrument development, data analysis, and data utilization, 
 will also earn a place in the libraries of students, faculty, researchers, engineers, and practitioners in fields like aerospace, electrical engineering, and astronomy.

Introduction to the Physics and Techniques of Remote Sensing — читать онлайн ознакомительный отрывок

Ниже представлен текст книги, разбитый по страницам. Система сохранения места последней прочитанной страницы, позволяет с удобством читать онлайн бесплатно книгу «Introduction to the Physics and Techniques of Remote Sensing», без необходимости каждый раз заново искать на чём Вы остановились. Поставьте закладку, и сможете в любой момент перейти на страницу, на которой закончили чтение.

Тёмная тема
Сбросить

Интервал:

Закладка:

Сделать

12 2Table B.1 Orbital velocity and period for circular orbits around some of the ...

List of Illustrations

1 Chapter 1 Figure 1.1 Diagram illustrating the different types of information sought af... Figure 1.2 Landsat MSS visible/near IR image of the Imperial Valley area in ... Figure 1.3 Folded mountains in the Sierra Madre region, Mexico (Landsat MSS)... Figure 1.4 Infrared image of the western hemisphere acquired from a meteorol... Figure 1.5 Multispectral satellite images of the Los Angeles basin acquired ... Figure 1.6 Passive microwave image of Antarctic ice cover acquired with a sp... Figure 1.7 Absorption spectrum of H 2O for two pressures (100 and 1000 mbars)... Figure 1.8 Spectral signature of some vegetation types. Figure 1.9 Landsat TM images of Death Valley acquired at 0.48 μm (a), 0.56 μ... Figure 1.10 Images of an area near Cuprite, Nevada, acquired with an airborn... Figure 1.11 Sea surface temperature derived from ship observations (a) and f... Figure 1.12 Backscatter data acquired over the Amazon region (insert). The d... Figure 1.13 Profile of Tharsis region (Mars) acquired with Earth‐based radar... Figure 1.14 Profiles of an unnamed impact basin on Mars using Earth‐based ra... Figure 1.15 Sea surface height over two trenches in the Caribbean acquired w... Figure 1.16 Shaded relief display of the topography of California measured b... Figure 1.17 Subsurface layering in the ice cover and bedrock profile acquire... Figure 1.18 Comparison of temperature profiles acquired with a microwave sou... Figure 1.19 Generalized absorption spectrum of the Earth’s atmosphere at zen...

2 Chapter 2 Figure 2.1 Electromagnetic spectrum. Figure 2.2 Polarization ellipse. Figure 2.3 Polarization represented as a point on the Poincaré sphere. Figure 2.4 Linear (upper) and circular (lower) polarization. Figure 2.5 Phase velocity. Figure 2.6 Group velocity. Figure 2.7 Doppler geometry for a moving source, fixed observer. Figure 2.8 Geometry illustrating wave fronts passing by a moving observer. Figure 2.9 Doppler geometry for a moving scatterer with fixed source and obs... Figure 2.10 Concept of radiance. Figure 2.11 Spectral luminous efficiency V ( λ ). Figure 2.12 Spectral radiant emittance of a blackbody at various temperature... Figure 2.13 Curve illustrating the exponential decrease of population as a f... Figure 2.14 An incident wave of frequency ν ijis adsorbed due to popula... Figure 2.15 Correspondence of spectral bands and photon energy and range of ... Figure 2.16 Transmission spectra of common silicates. Figure 2.17 Sketch of key elements of a remote sensing system.

3 Chapter 3 Figure 3.1 The surface spectral imprint is reflected in the spectrum of the ... Figure 3.2 Sun illumination spectral irradiance at the Earth's surface. Figure 3.3 Transmittivity of the Martian atmosphere. The model uses band par... Figure 3.4 Wave interaction with an interface. Figure 3.5 Reflection coefficient of a half‐space with two indices of refrac... Figure 3.6 For a polished surface there is an increase in the reflected ener... Figure 3.7 In the case of a particulate layer, the volume scattering and res... Figure 3.8 Bidirectional reflection spectra of four different particle size ... Figure 3.9 (a) H 2O molecule fundamental vibrational modes. (b) CO 2molecule ... Figure 3.10 Spectra of water‐bearing minerals illustrating the variations in... Figure 3.11 Spectra displaying the hydroxyl group tones: overtone near 1.4 μ ... Figure 3.12 Basis for the color characteristics of emerald and ruby. Figure 3.13 Spectra of minerals that contain ferrous ions in different cryst... Figure 3.14 Configurations of energy bands for different types of solid mate... Figure 3.15 Visible and infrared bidirectional reflection spectra of particu... Figure 3.16 Use of Fraunhofer lines to detect luminescent material from thei... Figure 3.17 Spectral signature diagram of a variety of geologic materials.... Figure 3.18 High‐resolution laboratory spectra of common minerals typically ... Figure 3.19 Spectral reflectance of a variety of biological materials. (a) R... Figure 3.20 Progressive changes in the spectral response of a sycamore leaf ... Figure 3.21 Variations in spectral reflectance as functions of amounts of gr... Figure 3.22 Reflectance spectra for a healthy beech leaf (1) and beech leave... Figure 3.23 Blue shift in the spectrum of conifers induced by a sulfide zone... Figure 3.24 Bidirectional leaf reflectance spectra of laboratory‐grown shore... Figure 3.25 Vegetation effects of green grass cover on spectral reflectance ... Figure 3.26 (a) Representation of the effect of increasing sample thickness ... Figure 3.27 Sketch of major elements of an imaging sensor. The elements are ... Figure 3.28 Multispectral wave dispersion techniques. (a) Beamsplitter used ... Figure 3.29 Diffraction pattern of a circular aperture with uniform illumina... Figure 3.30 These graphs show cuts through the composite diffraction pattern... Figure 3.31 Diffraction patterns of a square aperture with uniform illuminat... Figure 3.32 Imaging geometry showing the instantaneous field of view of a si... Figure 3.33 Comparison of the D *of various infrared detectors when oper... Figure 3.34 Charge coupled devices (CCD) linear array photograph (a) and ske... Figure 3.35 Fabrication process of modern detector arrays. Figure 3.36 Different types of imaging sensor implementations. Figure 3.37 Conceptual sketch of an imaging spectrometer. A narrow strip AB ... Figure 3.38 One possible design for the optical system of the imaging spectr... Figure 3.39 Landsat‐D mapping geometry. Figure 3.40 Thematic mapper optical system. Figure 3.41 The picture shown here was taken by the Mars Orbiter Camera narr... Figure 3.42 Data from the Mars Exploration Rover Opportunity's panoramic cam... Figure 3.43 Images of Saturn acquired with Cassini camera. Figure 3.44 Cassini imaging system. (a) Top, narrow angle and (b) bottom, wi... Figure 3.45 Image of Jupiter acquired with the Juno camera. Figure 3.46 Image of Jupiter acquired with the Juno camera.Figure 3.47 Chandrayaan imaging spectrometer.Figure 3.48 Sketch illustrating the principle of a scanning laser altimeter....Figure 3.49 Interaction of γ ‐rays with matter.Figure 3.50 Individual spectral channel images for the nine visible and near...Figure 3.51 Two color combination displays for the Cuprite scene shown in Fi...Figure 3.52 The same images shown in Figure 3.51 after performing a color st...Figure 3.53 Principal component images for the 9 visible and near‐infrared c...Figure 3.54 The principal components PC2, PC3, and PC4 are displayed as blue...Figure 3.55 Spectra of some minerals commonly associated with hydrothermal a...Figure 3.56 Spectral ratio image of the Cuprite scene. The ratios are 4/7 (r...Figure 3.57 Results of an unsupervised classification of the Cuprite scene. ...Figure 3.58 Results of a supervised classification of the Cuprite scene. The...Figure 3.59 This image shows the relative abundances of different materials ...Figure 3.60 (a) Io's spectral reflectance showing the step drop near 0.45 μ ...Figure 3.61 This graph shows a spectrum, taken by the Mars Exploration Rover...Figure 3.62 Geometry for Exercise 3.1.Figure 3.63 Energy levels of three different materials.Figure 3.64 Energy levels and allowable transitions for a hypothetical mater...

4 Chapter 4Figure 4.1 Spectral emissivity ∈ and spectral radiant emittance S ( λ , T )...Figure 4.2 Reflected (continuous line) and emitted (dashed line) energy spec...Figure 4.3 Geometry for derivation of heat equation.Figure 4.4 Behavior of the temperature wave as a function of depth.Figure 4.5 Diurnal temperature curves for varying (a) thermal inertia in cal...Figure 4.6 Plots of diurnal surface temperature versus local time for two di...Figure 4.7 Night (a) and day (b) thermal images of Death Valley. Thermal ine...Figure 4.8 Visible (left) and thermal infrared (right) images showing the ef...Figure 4.9 (a) Dispersion of quartz. (b) Transmission through a 12.8 μm thic...Figure 4.10 Infrared transmission spectra for some common silicates. Regions...Figure 4.11 Transmission spectra of minerals of different composition and st...Figure 4.12 Diagram illustrating the location of features and the type of vi...Figure 4.13 HCMR optical block diagram.Figure 4.14 Thermal infrared image over northern Death Valley acquired by TI...Figure 4.15 Visible (upper left) and thermal infrared images of Cuprite, Nev...Figure 4.16 Visible (upper left) and principal component images of the therm...Figure 4.17 Sharpened color thermal infrared principal component image of th...Figure 4.18 Day and night thermal infrared images of crater ejecta in the Te...Figure 4.19 False‐color THEMIS infrared image of the Ophir and Candor Chasma...Figure 4.20 Mean sea surface temperature for the period 1987–1999. The top p...Figure 4.21 Weekly averages of the sea surface temperature for a portion of ...

Читать дальше
Тёмная тема
Сбросить

Интервал:

Закладка:

Сделать

Похожие книги на «Introduction to the Physics and Techniques of Remote Sensing»

Представляем Вашему вниманию похожие книги на «Introduction to the Physics and Techniques of Remote Sensing» списком для выбора. Мы отобрали схожую по названию и смыслу литературу в надежде предоставить читателям больше вариантов отыскать новые, интересные, ещё непрочитанные произведения.


Отзывы о книге «Introduction to the Physics and Techniques of Remote Sensing»

Обсуждение, отзывы о книге «Introduction to the Physics and Techniques of Remote Sensing» и просто собственные мнения читателей. Оставьте ваши комментарии, напишите, что Вы думаете о произведении, его смысле или главных героях. Укажите что конкретно понравилось, а что нет, и почему Вы так считаете.

x