Robert F. Bruner - Applied Mergers and Acquisitions
Здесь есть возможность читать онлайн «Robert F. Bruner - Applied Mergers and Acquisitions» — ознакомительный отрывок электронной книги совершенно бесплатно, а после прочтения отрывка купить полную версию. В некоторых случаях можно слушать аудио, скачать через торрент в формате fb2 и присутствует краткое содержание. Жанр: unrecognised, на английском языке. Описание произведения, (предисловие) а так же отзывы посетителей доступны на портале библиотеки ЛибКат.
- Название:Applied Mergers and Acquisitions
- Автор:
- Жанр:
- Год:неизвестен
- ISBN:нет данных
- Рейтинг книги:5 / 5. Голосов: 1
-
Избранное:Добавить в избранное
- Отзывы:
-
Ваша оценка:
Applied Mergers and Acquisitions: краткое содержание, описание и аннотация
Предлагаем к чтению аннотацию, описание, краткое содержание или предисловие (зависит от того, что написал сам автор книги «Applied Mergers and Acquisitions»). Если вы не нашли необходимую информацию о книге — напишите в комментариях, мы постараемся отыскать её.
Applied Mergers and Acquisitions — читать онлайн ознакомительный отрывок
Ниже представлен текст книги, разбитый по страницам. Система сохранения места последней прочитанной страницы, позволяет с удобством читать онлайн бесплатно книгу «Applied Mergers and Acquisitions», без необходимости каждый раз заново искать на чём Вы остановились. Поставьте закладку, и сможете в любой момент перейти на страницу, на которой закончили чтение.
Интервал:
Закладка:
THE POPULAR MODEL FOR ASSET GROWTH
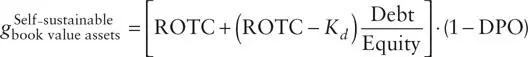
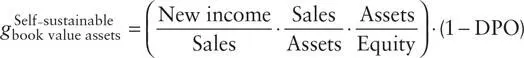
As a shorthand for estimating the self-sustainable growth rate, many analysts use the model shown in equation (2)and its variants, equations ( 3and 4):
(2) 
(3) 
(4) 
In the formulas, ROE is the accounting return on equity, ROTC is return on total capital 17 , Kd is the after-tax cost of debt, and DPO is the dividend payout ratio. 18 Equation (2)is simply an accrual-accounting version of M&M’s formula: (1 – DPO) is equivalent to M&M’s K . For ROE, many analysts use the expected return for the next few years. A less sensible assumption is to use the past few years’ average ROE.
Equation (3)expands the preceding equation by inserting a well-known formula for the ROE of a levered firm. The virtue of this form of the model is that it allows the analyst to tinker with a possible interdependence between the firm’s mix of capital and its cost of debt. For instance, the firm’s cost of debt might be supposed to rise as the firm increased its debt/equity ratio past some moderate level.
Equation (4)also expands equation (2)by inserting the well-known DuPont system of ratios for ROE. This version is appealing to operating managers since it decomposes ROE into a measure of margin profitability (net income/sales), a measure of asset turnover (sales/assets), and a measure of leverage (assets/equity). With the aid of this model, one can see more directly the effects of price or cost improvements and better asset utilization.
INSIGHTS TO BE GAINED FROM THE POPULAR ASSET GROWTH MODEL
Comparisons across Firms
The popular self-sustainable growth model can yield insights into the comparative strategic robustness of competitors within an industry. For instance, Exhibit 6A.1gives the calculations for the self-sustainable growth rates for five retailers competing in selling women’s apparel. The data, drawn from Value Line, 19 are forecasts of the variables for each firm in early 1991 for the period through 1995. Consider each firm’s strategic ability to grow and the sources of that strength.
EXHIBIT 6A.1 Self-Sustainable Growth Rates for Five Retailers
| Name | Self-Sustainable Growth Rate | Dividend Payout Ratio | Return on Total Capital | Hypothetical Bond Rating and After-Tax Cost of Debt | Debt-to-Equity Ratio |
|---|---|---|---|---|---|
| Charming Shoppes, Inc. | 13.2% | 15% | 14.5% | A 6.1% | 12.6% |
| Deb Shops, Inc. | 11.3% | 20% | 14.0% | Baa 6.6% | 2.0% |
| The Dress Barn | 17.5% | 0% | 17.5% | Baa 6.6% | 0.0% |
| Petrie Stores Corporation | 8.0% | 25% | 10.0% | Baa 6.6% | 19.0% |
| The Limited, Inc. | 27.6% | 22% | 23.0% | A 6.1% | 53.8% |
The exhibit reveals dramatic strategic disparities among these competitors. The Limited enjoys an unusually robust self-sustainable growth rate of 27.6 percent, stemming in large part from its high internal profitability and its relatively more aggressive use of debt capital. At the other end of the spectrum, Petrie Stores Corporation appears to be able to self-sustain only an 8 percent annual growth rate; this is due largely to its relatively low internal profitability. The Dress Barn stands out for its unusual set of financial policies: no debt and no dividends. Given that this firm has the second-highest internal profitability in the competitive group, The Dress Barn could probably boost its self-sustainable growth rate materially by even modest use of leverage.
Analysis of Policies within a Firm
The popular self-sustainable growth model may be solved in reverse to show what policy (or policies) can be changed, and with what effect, in order to achieve a targeted growth rate. Used in this way, the model can help an analyst prepare policy recommendations. As an illustration, suppose that the CEO of Acme Corporation, a privately held manufacturer of specialized machine tools, feels compelled by competitive conditions to set a target for the firm to grow at a 15 percent annual rate in order to survive and prosper in its market niche. Can this rate of growth be sustained? Exhibit 6A.2summarizes the modeling assumptions and the results.
Because Acme Corporation can self-sustain a growth rate of only 6.5 percent and needs to grow at 15 percent, management has a problem: how to increase the firm’s self-sustainable rate of growth. The CEO continues to analyze the operations of the firm and determines that any of the policy changes presented in Exhibit 6A.3would raise the self-sustainable growth rate to 15 percent.
EXHIBIT 6A.2 Summary of Modeling Assumptions
| Acme Corporation Self-Sustainable Growth Rate Analysis | Assumptions and Result |
|---|---|
| Dividend payout ratio | 50% |
| Target debt/equity ratio | 25% |
| Expected return on equity | 13% |
| Expected return on total capital | 11.4% |
| Expected after-tax cost of debt | 5% |
| New issues of common equity | Nil |
| Self-sustainable growth rate | 6.5% |
EXHIBIT 6A.3 Policy Changes to Raise Self-Sustainable Growth Rate
| Change in Policy | New Policy Target | Existing Policy | Required Change |
|---|---|---|---|
| Increase debt/equity ratio. Finance the growth with debt. | D/E = 2.9 | D/E = .25 | Tenfold relevering. |
| Sell equity. | DPO = –115% (i.e., sell about as much equity each year as you generate internally) | DPO = 50% (i.e., no equity sales) | Drop the dividend. Sell equity. |
| Improve internal profitability. | ROE = 30% ROTC = 25% | ROE = 13% ROTC = 11.4% | More than double the margins. |
| Improve internal profitability and increase debt/equity ratio. | ROTC = 18% D/E = .667 | ROTC = 11.4% D/E = .25 | Increase margins and leverage a lot. |
| Cut dividend payout ratio and improve internal profitability and increase debt/equity ratio. | DPO = 11.8% ROTC = 13% D/E = .50 | DPO = 25% ROTC = 11.4% D/E = .25 | Cut dividend in half. Double the leverage. Increase margins. |
Considering the various advantages and disadvantages, the fifth alternative, which involves a blend of changes in all policy areas, seems most attractive. A higher debt/equity ratio could still be consistent with average ratios in the industry and with the firm’s internal debt rating preferences. While the owners of the firm would feel the cut in dividend payments, the improvement in competitive standing might translate into capital gains later. Of all the policy changes, an increase in ROTC from 11.4 percent to 13 percent would be the hardest to implement, though management believes it is obtainable.
Analysis like this can be performed at a more detailed level, using spreadsheet forecasts. Churchill and Mullins (2001) illustrate the spreadsheet approach and show that, to avoid running out of cash, the firm can consider speeding up the cycle of operating cash within the firm, reducing costs, or raising prices.
Читать дальшеИнтервал:
Закладка:
Похожие книги на «Applied Mergers and Acquisitions»
Представляем Вашему вниманию похожие книги на «Applied Mergers and Acquisitions» списком для выбора. Мы отобрали схожую по названию и смыслу литературу в надежде предоставить читателям больше вариантов отыскать новые, интересные, ещё непрочитанные произведения.


Обсуждение, отзывы о книге «Applied Mergers and Acquisitions» и просто собственные мнения читателей. Оставьте ваши комментарии, напишите, что Вы думаете о произведении, его смысле или главных героях. Укажите что конкретно понравилось, а что нет, и почему Вы так считаете.