Robert F. Bruner - Applied Mergers and Acquisitions
Здесь есть возможность читать онлайн «Robert F. Bruner - Applied Mergers and Acquisitions» — ознакомительный отрывок электронной книги совершенно бесплатно, а после прочтения отрывка купить полную версию. В некоторых случаях можно слушать аудио, скачать через торрент в формате fb2 и присутствует краткое содержание. Жанр: unrecognised, на английском языке. Описание произведения, (предисловие) а так же отзывы посетителей доступны на портале библиотеки ЛибКат.
- Название:Applied Mergers and Acquisitions
- Автор:
- Жанр:
- Год:неизвестен
- ISBN:нет данных
- Рейтинг книги:5 / 5. Голосов: 1
-
Избранное:Добавить в избранное
- Отзывы:
-
Ваша оценка:
Applied Mergers and Acquisitions: краткое содержание, описание и аннотация
Предлагаем к чтению аннотацию, описание, краткое содержание или предисловие (зависит от того, что написал сам автор книги «Applied Mergers and Acquisitions»). Если вы не нашли необходимую информацию о книге — напишите в комментариях, мы постараемся отыскать её.
Applied Mergers and Acquisitions — читать онлайн ознакомительный отрывок
Ниже представлен текст книги, разбитый по страницам. Система сохранения места последней прочитанной страницы, позволяет с удобством читать онлайн бесплатно книгу «Applied Mergers and Acquisitions», без необходимости каждый раз заново искать на чём Вы остановились. Поставьте закладку, и сможете в любой момент перейти на страницу, на которой закончили чтение.
Интервал:
Закладка:
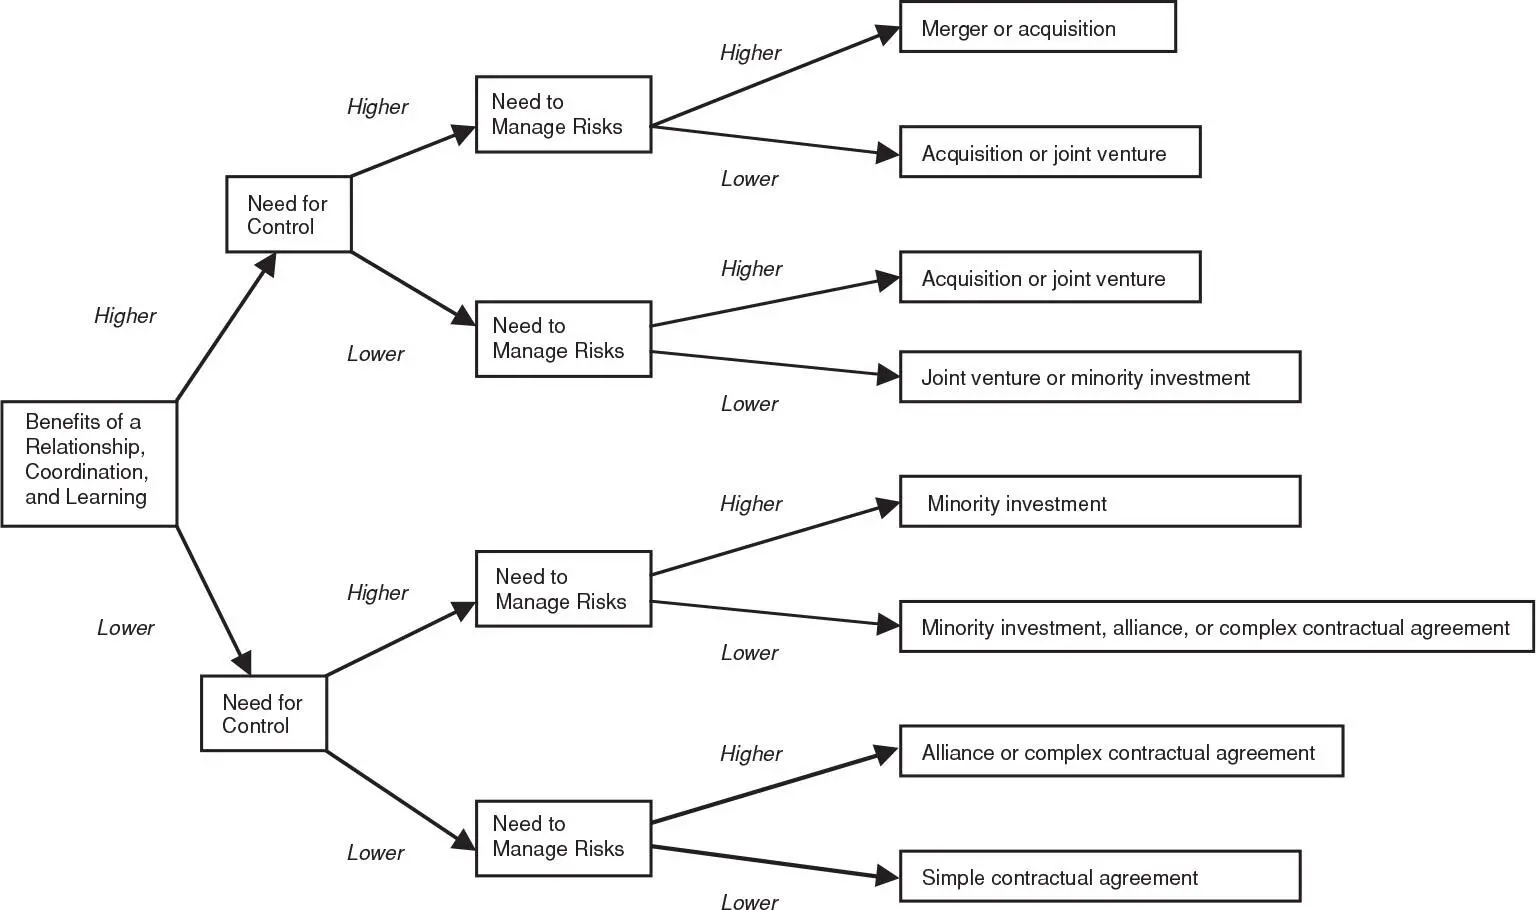
EXHIBIT 6.20 Decision Tree for Selecting among Inorganic Growth Opportunities
One kind of transaction does not fit all needs. Be skeptical of “one-trick ponies,” those proposals by brokers and advisers that always amount to an acquisition. As the diagram suggests, you can achieve strategic aims of inorganic growth through a variety of alternatives.
The choice among the alternatives is a logical result of balancing important considerations. Start the process by making a careful inventory of the decision criteria that are important to you. The three illustrated in Exhibit 6.20, relationship benefits, control, and risk management, will appear often in studies of inorganic growth alternatives. However, other considerations may be unique to a particular company or time, but no less important.
Retain a bias for simplicity. Contractual arrangements are probably easier to structure than relationships based on an equity investment. Also, simple agreements may be a better foundation for getting to know a partner; with complexity come more opportunities for misunderstanding.
Consider starting small. Staged investing will dominate lump-sum investing where risks are material. More is said about staged investing in Chapter 22.
Remember value creation. The subtext for any comparison of alternatives should be their impacts on shareholder welfare.
FRAMEWORK FOR CHOOSING A PATH FOR RESTRUCTURING
The selection among alternatives for restructuring rests on the considerations illustrated in the decision tree of Exhibit 6.21.
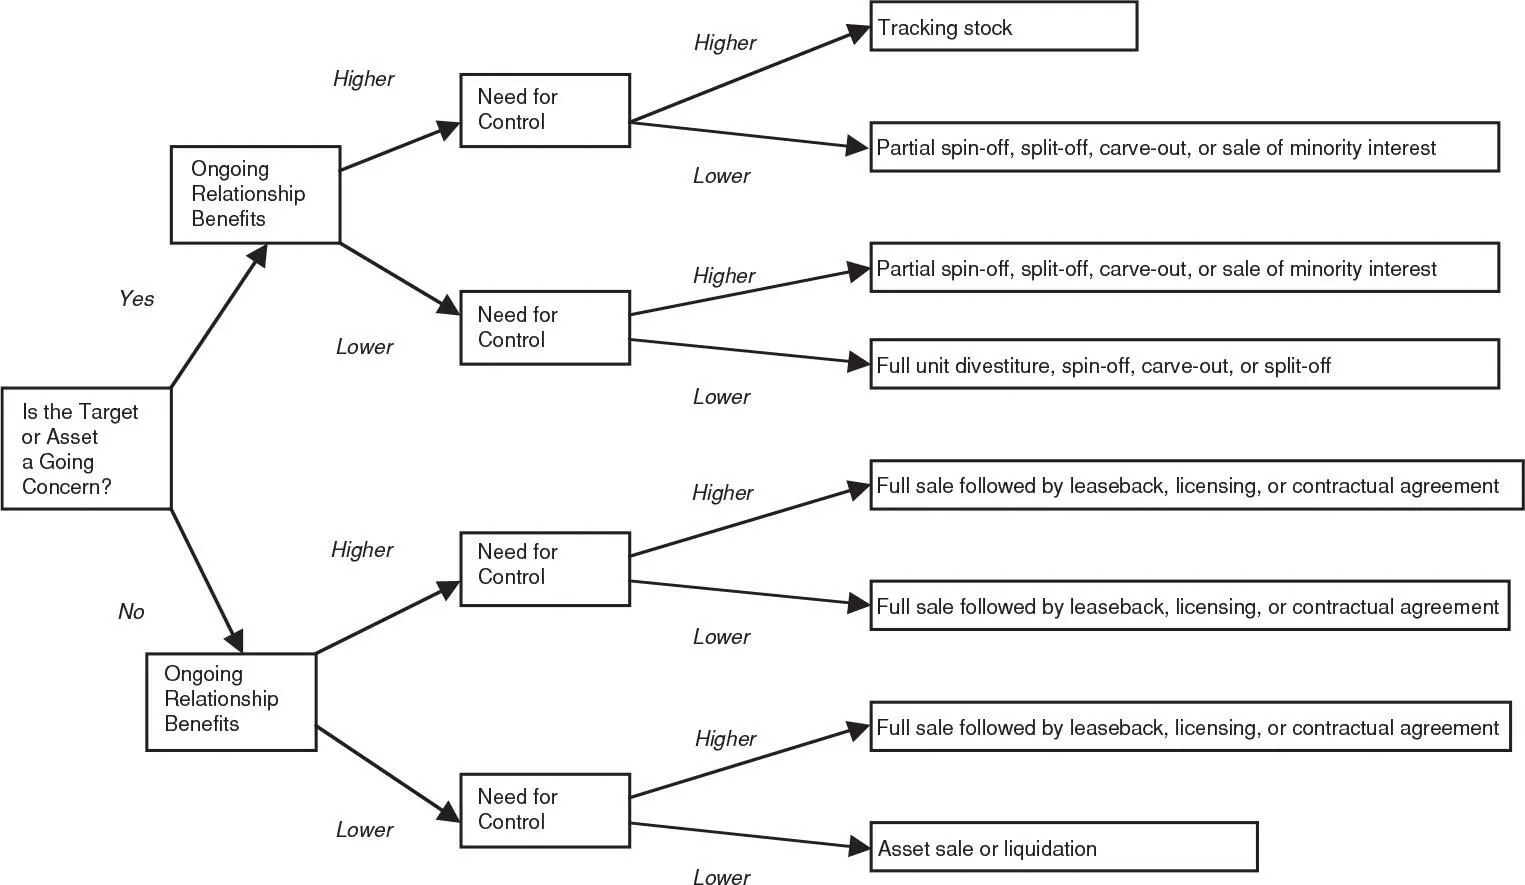
EXHIBIT 6.21 Decision Tree for Redeployment and Restructuring
Relationship to the core business of the parent. If the target operation is unrelated to the core it might be sold outright with no adverse effect on the rest of the firm. But if the benefits of relationship are material, your firm might consider retaining a partial interest in the target either as a joint venture or as a minority investment.
Need for control. Whether or not the asset or business remains strategically significant, your firm may want to retain some influence or control over the target if for no other reason than to assure that it does not fall into the hands of a competitor.
Can the business or asset operate as an independent entity? Assets such as land, factories, or equipment may be too small or isolated to sustain an independent existence. Such assets might be earmarked for outright sale. On the other hand, disposing of an ongoing business in the form of a firm can capture for the seller a premium reflecting growth prospects and franchise value.
Here again, to complete any strategic analysis of alternatives, one must assess the implications of each choice for shareholder value . This is done by means of a valuation analysis. No choice should be final until its implications for your firm’s share price are estimated and understood. The capital markets perspective embedded in valuation analysis may presuppose very different outlooks than the product markets perspective of the strategist. Also, there may be an information asymmetry reflected in the perspectives of the insiders and capital market outsiders (e.g., perhaps the discount rate derived from the capital markets is inconsistent with the inside strategic perspective).
DOES IT PAY TO DIVERSIFY OR FOCUS THE FIRM?
One of the robust debates today deals with whether and how the strategic efforts to diversify or focus the firm pay. The question is significant because of the prevalence of diversification-based business strategies among large firms today, and because of the relatively high volume of transactions motivated in part by a theory of the need to diversify or focus. Villalonga (2003) noted that between 1990 and 1996, diversified firms accounted for half of the employment in the United States, and 60 percent of the assets of traded firms. Following World War II, the U.S., European, and Japanese economies witnessed a dramatic increase in diversification and divisionalization. 6 Rumelt (1974) found that 70 percent of the Fortune 500 firms were heavily or exclusively focused on one segment. By 1969, that group had fallen to 35 percent, as shown in Exhibit 6.22. The icon of this trend was the conglomerate firm, which pursued a strategy of unrelated diversification. The conglomerate arose in the 1960s and then gradually receded in the 1970s and 1980s as firms returned to a greater emphasis on strategies of focused business operations.
Rumelt also found that profitability varied by type of diversification strategy: As the firm moved from great focus (a “single business” strategy) to great diversity (an “unrelated business” strategy), the accounting returns of firms varied materially by type of strategy. Exhibit 6.23summarizes these returns by category; see Rumelt (1974, pages 92, 94). Suggesting that a strategy of close relatedness in diversification yields the best returns, Rumelt’s findings were influential in prompting a critical reappraisal of conglomerate or unrelated diversification and became part of a general trend in the 1970s and 1980s toward increasing emphasis on strategic focus.
EXHIBIT 6.22 Changing Mix of Diversification Strategies for the Fortune 500 Firms
| Strategic Category | Percentage of Firms in Each Strategic Category | ||
|---|---|---|---|
| 1949 | 1959 | 1969 | |
| Single business | 34.5% | 16.2% | 6.2% |
| Dominant business | 35.4% | 37.3% | 29.2% |
| Related business | 26.7% | 40.0% | 45.2% |
| Unrelated business | 3.4% | 6.5% | 19.4% |
Note: “Single business” indicates firms focused entirely on one industry segment—not multibusiness firms.
“Dominant business” indicates firms deriving between 70 and 95 percent of their revenues from one segment and 70 to 100 percent from the largest related group of businesses.
“Related business” indicates firms deriving up to 70 percent of revenues from one segment and 70 to 100 percent from the largest related group of businesses.
“Unrelated business” indicates firms with relatively low influence from one single segment or group of related segments.
Source of data: Rumelt (1974), page 51.
EXHIBIT 6.23 Returns by Diversification Strategy
| Category | Return on Capital | Return on Equity |
|---|---|---|
| Single business | 10.81% | 13.20% |
| Dominant business | 9.64% | 11.64% |
| Related business | 11.49% | 13.55% |
| Unrelated business | 9.49% | 11.92% |
Note: “Single business” indicates firms focused entirely on one industry segment—not multibusiness firms.
“Dominant business” indicates firms deriving between 70 and 95 percent of their revenues from one segment and 70 to 100 percent from the largest related group of businesses.
“Related business” indicates firms deriving up to 70 percent of revenues from one segment and 70 to 100 percent from the largest related group of businesses.
“Unrelated business” indicates firms with relatively low influence from one single segment or group of related segments.
Читать дальшеИнтервал:
Закладка:
Похожие книги на «Applied Mergers and Acquisitions»
Представляем Вашему вниманию похожие книги на «Applied Mergers and Acquisitions» списком для выбора. Мы отобрали схожую по названию и смыслу литературу в надежде предоставить читателям больше вариантов отыскать новые, интересные, ещё непрочитанные произведения.


Обсуждение, отзывы о книге «Applied Mergers and Acquisitions» и просто собственные мнения читателей. Оставьте ваши комментарии, напишите, что Вы думаете о произведении, его смысле или главных героях. Укажите что конкретно понравилось, а что нет, и почему Вы так считаете.