Robert F. Bruner - Applied Mergers and Acquisitions
Здесь есть возможность читать онлайн «Robert F. Bruner - Applied Mergers and Acquisitions» — ознакомительный отрывок электронной книги совершенно бесплатно, а после прочтения отрывка купить полную версию. В некоторых случаях можно слушать аудио, скачать через торрент в формате fb2 и присутствует краткое содержание. Жанр: unrecognised, на английском языке. Описание произведения, (предисловие) а так же отзывы посетителей доступны на портале библиотеки ЛибКат.

- Название:Applied Mergers and Acquisitions
- Автор:
- Жанр:
- Год:неизвестен
- ISBN:нет данных
- Рейтинг книги:5 / 5. Голосов: 1
-
Избранное:Добавить в избранное
- Отзывы:
-
Ваша оценка:
Applied Mergers and Acquisitions: краткое содержание, описание и аннотация
Предлагаем к чтению аннотацию, описание, краткое содержание или предисловие (зависит от того, что написал сам автор книги «Applied Mergers and Acquisitions»). Если вы не нашли необходимую информацию о книге — напишите в комментариях, мы постараемся отыскать её.
Applied Mergers and Acquisitions — читать онлайн ознакомительный отрывок
Ниже представлен текст книги, разбитый по страницам. Система сохранения места последней прочитанной страницы, позволяет с удобством читать онлайн бесплатно книгу «Applied Mergers and Acquisitions», без необходимости каждый раз заново искать на чём Вы остановились. Поставьте закладку, и сможете в любой момент перейти на страницу, на которой закончили чтение.
Интервал:
Закладка:
DRIVERS OF INDUSTRY ATTRACTIVENESS (PORTER MODEL): HOW ATTRACTIVE WILL THIS INDUSTRY BE?Drawing on research in the subfield of economics, called industrial organization, Michael Porter (1980) presented a framework that characterized industry structure and competitive conduct as drivers of competitive success in an industry. His framework highlighted the role of five factors as driving economic attractiveness of an industry:
1 Barriers to entry. In theory, if an industry offers high returns, new entrants will be attracted into it, thus driving returns to a more normal level. But barriers may exist (or may be constructed) that prevent this from happening and enable current players in an industry to enjoy sustained high returns. Classic examples of entry barriers include regulatory restrictions (e.g., you must have a banking or broadcasting license from the government to compete), brand names (hard to develop and/or imitate), patents (illegal to exploit without ownership or license), high capital requirements (you must build a large greenfield plant to become a viable competitor), and unique know-how (Wal-Mart’s “hot docking” technique of logistics management). Porter highlighted the role of accumulated experience as a potential barrier—this learning curve effect is illustrated in Exhibit 6.6and consists in reducing one’s cost of production as know-how accumulates. The effect of learning is apparent, for instance, in the substantial decline in the price of semiconductors over time: Unit costs decline by about 20 percent with each doubling of accumulated production. The learning curve gives a competitive advantage to the first or early mover. This benefit can be achieved in either of two ways. First, one can accumulate experience faster than one’s competitors can (e.g., through higher volume production or more rapid product changes) and thus get farther down the common learning curve faster. Second, one can try to steepen the slope of learning through larger leaps in internal development or the acquisition of know-how from outside the firm. Exhibit 6.6shows the dramatic effects on unit cost of differing rates of cost reduction. Abernathy and Wayne (1974) discuss the impact of experience in various industries.
2 Customer power. Powerful customers can strongly influence prices and product quality in an industry. Examples are Wal-Mart and Federated Department Stores for consumer goods, and the U.S. government for the U.S. defense industry. Weak customers, on the other hand, are likely to be mere price-takers—examples would be consumers of filmed entertainment, cigarettes, and education. In those industries, the suppliers have been able to sustain prices increases well ahead of the rate of inflation.Slope Base Cost Cumulative Unit Production10% Cost Reduction 0.1 $100.0020% Cost Reduction 0.2 $100.0030% Cost Reduction 0.3 $100.000$100.00$100.00$100.0010$ 90.00$ 80.00$ 70.0020$ 81.00$ 64.00$ 49.0040$ 72.90$ 51.20$ 34.3080$ 65.61$ 40.96$ 24.01160$ 59.05$ 32.77$ 16.81320$ 53.14$ 26.21$ 11.76 EXHIBIT 6.6 Illustration of Learning CurveSource: Author’s analysis.
3 Supplier power. Similarly, powerful suppliers (e.g., monopolists) can extract high prices from firms in an industry. Weak suppliers can be a source of positive value to an industry—through most of the 1990s, the U.S. auto industry extracted material price reductions and quality improvements from its suppliers.
4 Threat of substitutes. Substitutes limit the pricing power of competitors in an industry. For instance, the price of coal quoted to electric power generators is influenced by the prices of Btu (British thermal unit) substitutes such as oil and natural gas.
5 Rivalry conduct. This final force captures the effects of dynamic competition among players in an industry. Investment in new product or process innovation, opening new channels of distribution, and entry into new geographic markets can alter the balance of competitive advantage. Cartel agreements (banned under the antitrust regulations in most countries) create industries with few adverse surprises for its players. At the other extreme, predatory pricing aimed at driving peers out of business can produce sharp variations in profitability. Porter noted that rivalry may be sharper where the players are similar in size, the barriers to exit from an industry are high, fixed costs are high, growth is slow, and products or services are not differentiated.
STRATEGIC MAP AND STRATEGIC CANVAS: HOW DOES OUR STRATEGY COMPARE WITH OTHERS?Assessing the industry and comparing the market shares of the players tells little about how they got there, and where they might be headed next. It is necessary to profile the strategies of competitors as a foundation for developing a strategy for your own business. Two tools are particularly useful here:
The first is a strategic map that, like a growth-share matrix, positions the players in an industry on the basis of size and two other dimensions that are strategically meaningful. Exhibit 6.7gives an example of competing brands of sporty cars in the U.S. market, mapped on the basis of size, price/quality/image, and geographic market coverage. A map such as this helps to reveal niches of competition or strategic groups of competitors, as well as gaps in the competitive field where a firm might find unserved demand and/or a relatively safer haven from competition. In the example one observes two clusters: (1) high price/quality/image with small size and restricted geographic base and (2) medium price/quality/image with larger size and geographic base. Porter (1980) discusses the import of strategic group analysis at more length.
The second tool is a strategic canvas that illustrates in graphic form the similarity or difference among competitors’ strategies. Exhibit 6.8gives an example of a strategic canvas for two retailers, Brooks Brothers (a high-end primarily men’s apparel retailer) and the Big & Tall Men’s Shop (a mass-market men’s apparel retailer). The exhibit shows that the two retailers’ strategies vary markedly. Writing about the strategic canvas, Kim and Mauborgne (2002) said, “It does three things in one picture. First, it shows the strategic profile of an industry by depicting very clearly the factors that affect competition among industry players, as well as those that might in the future. Second, it shows the strategic profile of current and potential competitors, identifying which factors they invest in strategically. Finally our approach draws the company’s strategic profile … showing how it invests in the factors of competition and how it might invest in them in the future.” ( Page 78)
| Price/Quality/Image (Max = 100) | Geographic Market Coverage (Max = 100) | Relative Size (Max = 100) | |
|---|---|---|---|
| GM Corvette | 75 | 100 | 100 |
| Ford Thunderbird | 40 | 95 | 95 |
| Chrysler Prowler | 50 | 85 | 80 |
| BMW Z4 | 98 | 50 | 20 |
| Porsche Boxster | 100 | 30 | 5 |
| Mazda Miata | 60 | 70 | 30 |
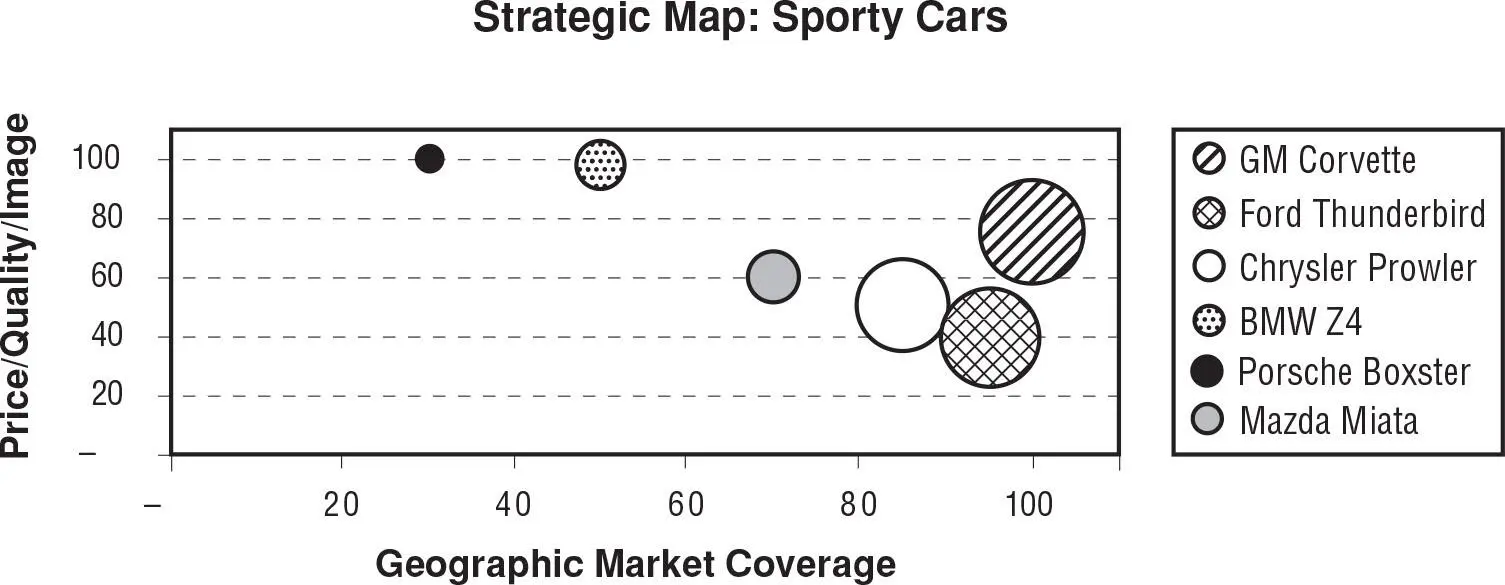
EXHIBIT 6.7 Illustration of Strategic Map
Source: Qualitative assessment based on author’s analysis.
Excel templates for the strategic map and strategic canvas are given in two programs on the CD-ROM, “Strategic Map.xls,” and “Strategic Canvas.xls.”
ATTRACTIVENESS-STRENGTH MATRIX: HOW DO RETURNS VARY WITH INDUSTRY POSITION AND INDUSTRY ATTRACTIVENESS?General Electric sought to combine an assessment of the attractiveness of an industry (i.e., the ability of the industry to generate attractive investment returns) and the attractiveness of the position within the industry, drawing on the research that showed a direct correlation between market share and returns. Industry attractiveness would be assessed through a Porter-style analysis of growth and prospective returns based on structure and conduct of the industry, and the drivers of change. The firm’s position would be assessed through measures such as market share and costs to produce, and qualitative assessments of resources, capabilities, and core competencies. The firm’s business units and their industries are typically scored by means of a weighted average of ratings on various dimensions. These scores are used to place the various units in the nine-cell grid shown in Exhibit 6.9. The cells located toward the upper-left corner of the grid will be more attractive business/industry combinations—the grid implies that these should merit priority treatment for investment. Similarly, the lower right cells are least attractive and would be candidates for divestment or at least a highly skeptical investment stance. Compared to the BCG growth-share matrix, this matrix admits a wider range of criteria on which to judge the attractiveness of a business and its industry. But the scoring system for producing the ratings for business and industry attractiveness is arbitrary and may not be linked to financial returns in an obvious way. This exposes the analyst and audience to possible abuses.
Читать дальшеИнтервал:
Закладка:
Похожие книги на «Applied Mergers and Acquisitions»
Представляем Вашему вниманию похожие книги на «Applied Mergers and Acquisitions» списком для выбора. Мы отобрали схожую по названию и смыслу литературу в надежде предоставить читателям больше вариантов отыскать новые, интересные, ещё непрочитанные произведения.


Обсуждение, отзывы о книге «Applied Mergers and Acquisitions» и просто собственные мнения читателей. Оставьте ваши комментарии, напишите, что Вы думаете о произведении, его смысле или главных героях. Укажите что конкретно понравилось, а что нет, и почему Вы так считаете.