Using Predictive Analytics to Improve Healthcare Outcomes
Здесь есть возможность читать онлайн «Using Predictive Analytics to Improve Healthcare Outcomes» — ознакомительный отрывок электронной книги совершенно бесплатно, а после прочтения отрывка купить полную версию. В некоторых случаях можно слушать аудио, скачать через торрент в формате fb2 и присутствует краткое содержание. Жанр: unrecognised, на английском языке. Описание произведения, (предисловие) а так же отзывы посетителей доступны на портале библиотеки ЛибКат.
- Название:Using Predictive Analytics to Improve Healthcare Outcomes
- Автор:
- Жанр:
- Год:неизвестен
- ISBN:нет данных
- Рейтинг книги:5 / 5. Голосов: 1
-
Избранное:Добавить в избранное
- Отзывы:
-
Ваша оценка:
Using Predictive Analytics to Improve Healthcare Outcomes: краткое содержание, описание и аннотация
Предлагаем к чтению аннотацию, описание, краткое содержание или предисловие (зависит от того, что написал сам автор книги «Using Predictive Analytics to Improve Healthcare Outcomes»). Если вы не нашли необходимую информацию о книге — напишите в комментариях, мы постараемся отыскать её.
Discover a comprehensive overview, from established leaders in the field, of how to use predictive analytics and other analytic methods for healthcare quality improvement. Using Predictive Analytics to Improve Healthcare Outcomes
before
proven in advance
Using Predictive Analytics to Improve Healthcare Outcomes
Using Predictive Analytics to Improve Healthcare Outcomes — читать онлайн ознакомительный отрывок
Ниже представлен текст книги, разбитый по страницам. Система сохранения места последней прочитанной страницы, позволяет с удобством читать онлайн бесплатно книгу «Using Predictive Analytics to Improve Healthcare Outcomes», без необходимости каждый раз заново искать на чём Вы остановились. Поставьте закладку, и сможете в любой момент перейти на страницу, на которой закончили чтение.
Интервал:
Закладка:
For ease of understanding, items in the same construct would be the same color, and items in each color would then be arranged with those considered most influential positioned closest to the variable of interest. Selecting the most influential variables is important because you may decide you have only enough time or resources to address some of the variables. If this is the case, select those variables that are perceived to be the most influential.
A collection of three worksheets used by a neurosurgical nursing care unit for a study on workload, showing the progression from a full list of predictor variables to a workable model (Steps 2–5), can be found in Appendix A. These worksheets visually represent the conversion of a structural model to a measurement model. While Figure 1.1offers a visual representation of a model with multiple constructs, showing the variables arranged by rank, Appendix Ashows a slightly different visual representation, which is the representation typically used by the author of this chapter. Readers are encouraged to try both methods of representing the constructs to see which is more useful in understanding and visually communicating the information.
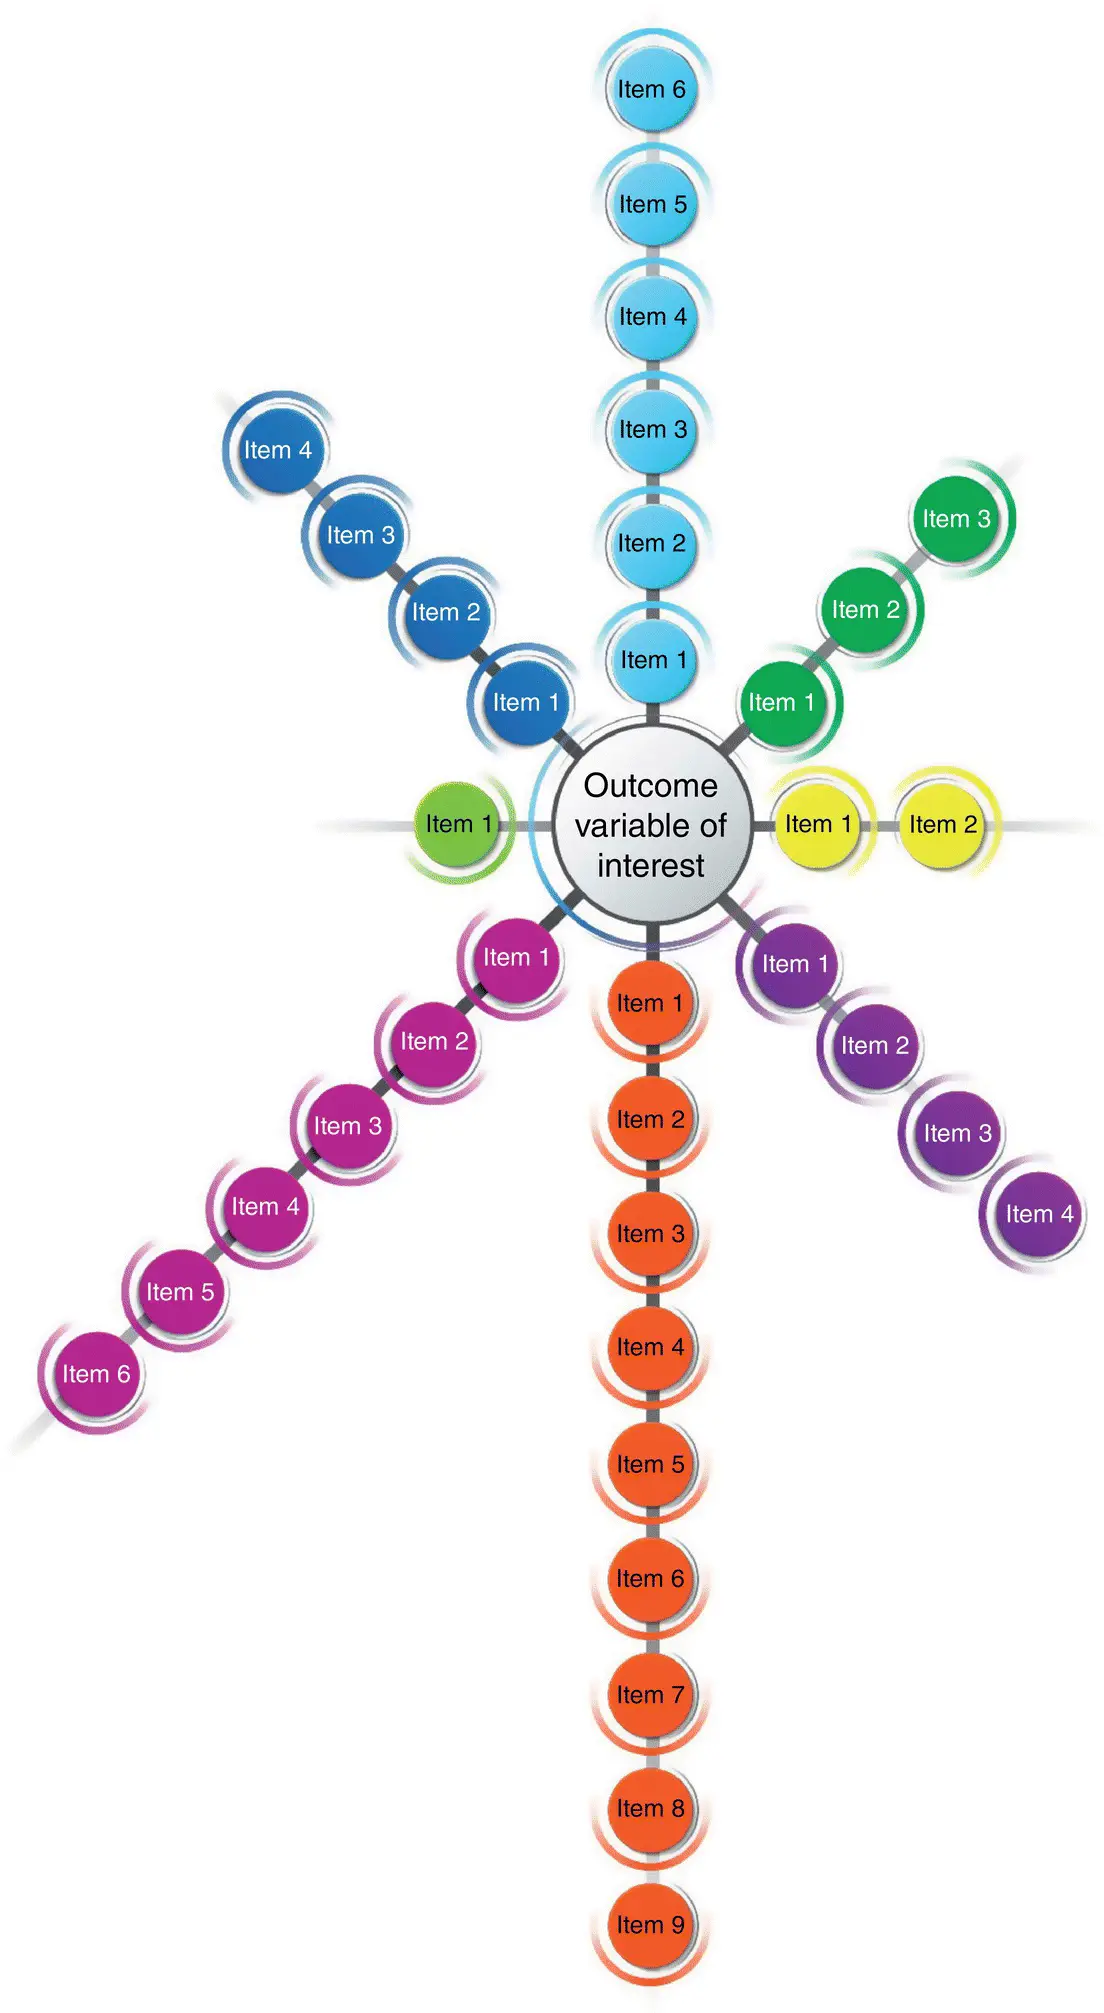
Figure 1.1 Variable of interest surrounded by constructs of predictor variables, arranged by rank.
Step 6: Evaluate if and/or Where Data on the Predictor Variables Is Already Being Collected (AKA, Data Discovery)
Investigate whether data on any of the predictor variables in your model is already being collected in current databases within your organization. Where you find that data is already being collected, you will use the existing data. You may find that data related to the variables of interest is being collected in more than one place, which will provide an opportunity for consolidation, making your data management process more efficient and standardized.
Step 7: Find Ways to Measure Predictor Variables Not Currently Being Measured
If there are important variables not being measured, it will be necessary to develop ways to measure them. If influential variables are left out of the study, the model will remain mis‐specified (wrong).
If influential variables are left out of the study, the model will remain mis‐specified (wrong).
Step 8: Select an Analytic Method
This work will likely be overseen by an in‐house or consultant mathematician, statistician, or data analyst. Consider types of analytics beyond linear methods or qualitative descriptive methods, which are the most common methods currently used in healthcare. For example, if the dataset is very large and complex and it is not clear how to sort the predictor variables in a linear method such as regression analysis, try Pareto mathematics where outliers are examined. Pareto mathematics looks at the highs and lows in the dataset to create a profile of success factors. In his book Where Medicine Went Wrong: Rediscovering the Path to Complexity , Dr. Bruce West asserts that Gaussian mathematics throws out the extreme values despite the fact that these extreme values often provide the most valuable information because they provide a profile of the biggest successes and the biggest failures (2007).
Another type of analysis to consider is constructal theory, a method derived from physics, which is the study of “flow” (Bejan & Zane, 2012). If employees are able to talk about what makes their work flow or what makes their work pause, constructal theory will allow for their comments to be themed and addressed operationally. It is the experience of this author that if employees can talk about their workflow, and data can then be arranged for them in themes, the employees get excited about working on productivity because it is readily apparent to them that the overall aim is figuring out how to do more of what works well and less of what does not. Constructal theory makes productivity, or the lack of it, visible. Gaussian mathematics provides insight into linear processes, while analyses like Parato mathematics and constructal theory provide insight into more dynamic/complex and unknown processes, respectively. Pairing the analytic method with the variable of interest is important to achieving insight into the operations of work and associated outcomes.
The overall aim is figuring out how to do more of what works well and less of what does not.
For your most complex models, you may want to consider using a machine learning problem designed to let the computer tell you the rank order of predictor variables as they relate to your variable of interest. This is suggested on the condition that you never allow the machine to have the “final say.” Machines function without regard for theory and context, so they are not able to tell a story capable of deeply resonating with the people whose work is being measured. It is tempting to be lazy and not do the work of carefully building models based on theory and rich in context that will result in data that makes people excited to take action. More on machine learning can be found in Chapter 6.
Step 9: Collect Retrospective Data Right Away and Take Action
If available, use retrospective data (data used for reporting what has already happened) to determine which predictor variables, of those already being measured, most closely relate to your variable of interest. Have a mathematician, statistician, or data analyst run a correlation table of all the predictor variables. Most organizations employ or contract with mathematicians, statisticians, and/or others who know how to run and read a correlation table using statistics software such as SPSS, SAS, or R. The mathematician, statistician, or analyst will be able to identify all the predictor variables found to have a relationship with the variable of interest and rank them in order of the strength of the relationship. (Many examples of these ranked predictor variables will appear in this book.) This will help start a meaningful conversation about what is being discovered while data on the remaining variables from the measurement model is still being collected manually. If actionable information is discovered during this step, operational changes can be implemented immediately. Further examination of the data will continue, but if what you have discovered by this point makes some opportunities for improvements apparent, do not wait to improve operations!
Step 10: Examine Data Before Analysis
Once the data is collected, it is tempting to proceed directly to the fun part and view the results. How do things relate to one another? What are the high and low scores? Viewing the results that answer questions like these is rewarding; however, prior to viewing any results (even in Step 9, where you may have gathered together some pretty compelling retrospective data), it is critical to ensure that all the data is correct. Have the statistician, analyst, or mathematician use statistics software, or even Excel, to examine the distribution of the scores and look for indications that there is missing data. If the distribution of the data for any predictor variable has a prominent leaning toward low or high scores, with a few outliers, the analyst will need to decide whether the outliers should be removed or whether the data should be weighted. If there are patterns of missing data (e.g. one item from a construct has many missing scores), then the group should discuss why the data is missing and what to do about it. Understanding the distribution and missing data will provide additional insight into the population being studied.
Читать дальшеИнтервал:
Закладка:
Похожие книги на «Using Predictive Analytics to Improve Healthcare Outcomes»
Представляем Вашему вниманию похожие книги на «Using Predictive Analytics to Improve Healthcare Outcomes» списком для выбора. Мы отобрали схожую по названию и смыслу литературу в надежде предоставить читателям больше вариантов отыскать новые, интересные, ещё непрочитанные произведения.


Обсуждение, отзывы о книге «Using Predictive Analytics to Improve Healthcare Outcomes» и просто собственные мнения читателей. Оставьте ваши комментарии, напишите, что Вы думаете о произведении, его смысле или главных героях. Укажите что конкретно понравилось, а что нет, и почему Вы так считаете.