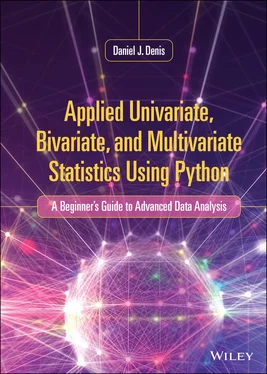
Daniel J. Denis - Applied Univariate, Bivariate, and Multivariate Statistics Using Python
Здесь есть возможность читать онлайн «Daniel J. Denis - Applied Univariate, Bivariate, and Multivariate Statistics Using Python» — ознакомительный отрывок электронной книги совершенно бесплатно, а после прочтения отрывка купить полную версию. В некоторых случаях можно слушать аудио, скачать через торрент в формате fb2 и присутствует краткое содержание. Жанр: unrecognised, на английском языке. Описание произведения, (предисловие) а так же отзывы посетителей доступны на портале библиотеки ЛибКат.
- Название:Applied Univariate, Bivariate, and Multivariate Statistics Using Python
- Автор:
- Жанр:
- Год:неизвестен
- ISBN:нет данных
- Рейтинг книги:3 / 5. Голосов: 1
-
Избранное:Добавить в избранное
- Отзывы:
-
Ваша оценка:
- 60
- 1
- 2
- 3
- 4
- 5
Applied Univariate, Bivariate, and Multivariate Statistics Using Python: краткое содержание, описание и аннотация
Предлагаем к чтению аннотацию, описание, краткое содержание или предисловие (зависит от того, что написал сам автор книги «Applied Univariate, Bivariate, and Multivariate Statistics Using Python»). Если вы не нашли необходимую информацию о книге — напишите в комментариях, мы постараемся отыскать её.
A practical, “how-to” reference for anyone performing essential statistical analyses and data management tasks in Python Applied Univariate, Bivariate, and Multivariate Statistics Using Python
Applied Univariate, Bivariate, and Multivariate Statistics Using Python
Applied Univariate, Bivariate, and Multivariate Statistics Using Python
Applied Univariate, Bivariate, and Multivariate Statistics Using Python — читать онлайн ознакомительный отрывок
Ниже представлен текст книги, разбитый по страницам. Система сохранения места последней прочитанной страницы, позволяет с удобством читать онлайн бесплатно книгу «Applied Univariate, Bivariate, and Multivariate Statistics Using Python», без необходимости каждый раз заново искать на чём Вы остановились. Поставьте закладку, и сможете в любой момент перейти на страницу, на которой закончили чтение.
Интервал:
Закладка:
The book is the fourth in a series of books published by the author, all with Wiley. Readers wishing a deeper discussion of the topics treated in this book are encouraged to consult the author’s first book, now in its second (and better) edition titled Applied Univariate, Bivariate, and Multivariate Statistics: Understanding Statistics for Social and Natural Scientists, with Applications in SPSS and R (2021 ). The book encompasses a much more thorough overview of many of the techniques featured in the current book, featuring the use of both R and SPSS software. Readers wishing a book similar to this one, but instead focusing exclusively on R or SPSS, are encouraged to consult the author’s other two books, Univariate, Bivariate, and Multivariate Statistics Using R: Quantitative Tools for Data Analysis and Data Scienceand SPSS Data Analysis for Univariate, Bivariate, and Multivariate Statistics. Each of these texts are far less theory-driven and are more similar to the current book in this regard, focusing on getting results quickly and interpreting findings for research reports, dissertations, or publication. Hence, depending on which software is preferred, readers (and instructors) can select the text best suited to their needs. Many of the data sets repeat themselves across texts. It should be emphasized, however, that all of these books are still at a relatively introductory level, even if surveying relatively advanced univariate and multivariate statistical techniques.
Features used in the book to help channel the reader’s focus:
Bullet points appear throughout the text. They are used primarily to detail and interpret output generated by Python. Understanding and interpreting output is a major focus of the book.
“Don’t Forget!”
Brief “don’t forget” summaries serve to emphasize and reinforce that which is most pertinent to the discussion and to aid in learning these concepts. They also serve to highlight material that can be easily misunderstood or misapplied if care is not practiced. Scattered throughout the book, these boxes help the reader review and emphasize essential material discussed in the chapters.
Each chapter concludes with a brief set of exercises. These include both conceptually-based problems that are targeted to help in mastering concepts introduced in the chapter, as well as computational problems using Python.
Most concepts are implicitly defined throughout the book by introducing them in the context of how they are used in scientific and statistical practice. This is most appropriate for a short book such as this where time and space to unpack definitions in entirety is lacking. “Dictionary definitions” are usually grossly incomplete anyway and one could even argue that most definitions in even good textbooks often fail to capture the “essence” of the concept. It is only in seeing the term used in its proper context does one better appreciate how it is employed, and, in this sense, the reader is able to unpack the deeper intended meaning of the term. For example, defining a population as the set of objects of ultimate interest to the researcher is not enlightening. Using the word in the context of a scientific example is much more meaningful. Every effort in the book is made to accurately convey deeper conceptual understanding rather than rely on superficial definitions.
Most of the book was written at the beginning of the COVID-19 pandemic of 2020 and hence it seemed appropriate to feature examples of COVID-19 in places throughout the book where possible, not so much in terms of data analysis, but rather in examples of how hypothesis-testing works and the like. In this way, it is hoped examples and analogies “hit home” a bit more for readers and students, making the issues “come alive” somewhat rather than featuring abstract examples.
Python code is “unpacked” and explained in many, though not all, places. Many existing books on the market contain explanations of statistical concepts (to varying degrees of precision) and then plop down a bunch of code the reader is expected to simply implement and understand. While we do not avoid this entirely, for the most part we guide the reader step-by-step through both concepts and Python code used. The goal of the book is in understanding how statistical methods work, not arming you with a bunch of code for which you do not understand what is behind it. Principal components code, for instance, is meaningless if you do not first understand and appreciate to some extent what components analysis is about.
Statistical Knowledge vs. Software Knowledge
Having now taught at both the undergraduate and graduate levels for the better part of fifteen years to applied students in the social and sometimes natural sciences, to the delight of my students (sarcasm), I have opened each course with a lecture of sorts on the differences between statistical vs. software knowledge. Very little of the warning is grasped I imagine, though the real-life experience of the warning usually surfaces later in their graduate careers (such as at thesis or dissertation defenses where they may fail to understand their own software output). I will repeat some of that sermon here. While this distinction, historically, has always been important, it is perhaps no more important than in the present day given the influx of computing power available to virtually every student in the sciences and related areas, and the relative ease with which such computing power can be implemented. Allowing a new teen driver to drive a Dodge Hellcat with upward of 700 horsepower would be unwise, yet newcomers to statistics and science, from their first day, have such access to the equivalent in computing power. The statistician is shaking his or her head in disapproval, for good reason. We live in an age where data analysis is available to virtually anybody with a laptop and a few lines of code. The code can often easily be dug up in a matter of seconds online, even with very little software knowledge. And of course, with many software programs coding is not even a requirement, as windows and GUIs (graphical user interfaces) have become very easy to use such that one can obtain an analysis in virtually seconds or even milliseconds. Though this has its advantages, it is not always and necessarily a good thing.
On the one hand, it does allow the student of applied science to “attempt” to conduct his or her data analyses. Yet on the other, as the adage goes, a little knowledge can be a dangerous thing. Being a student of the history of statistics, I can tell you that before computers were widely available, conducting statistical analyses were available only to those who could drudge through computations by hand in generating their “output” (which of course took the form of paper-and-pencil summaries, not the software output we have today). These computations took hours upon hours to perform, and hence, if one were going to do a statistical analysis, one did not embark on such an endeavor lightly. That does not mean the final solution would be valid necessarily, but rather folks may have been more likely to give serious thoughtto their analyses before conducting them. Today, a student can run a MANOVA in literally 5 minutes using software, but, unfortunately, this does not imply the student will understand what they have done or why they have done it. Random assignment to conditionsmay have never even been performed, yet in the haste to implement the software routine, the student failed to understand or appreciate how limiting their output would be. Concepts of experimental designget lost in the haste to produce computer output. However, the student of the “modern age” of computing somehow “missed” this step in his or her quickness to, as it were, perform “advanced statistics.” Further, the result is “statistically significant,” yet the student has no idea what Wilks’s lambda is or how it is computed, nor is the difference between statistical significanceand effect sizeunderstood. The limitations of what the student has produced are not appreciated and faulty substantive (and often philosophically illogical) conclusions follow. I kid you not, I have been told by a new student before that the only problem with the world is a lack of computing power. Once computing power increases, experimental design will be a thing of the past, or so the student believed. Some incoming students enter my class with such perceptions, failing to realize that discovering a cure for COVID-19, for instance, is not a computer issue. It is a scientific one. Computers help, but they do not on their own resolve scientific issues. Instructors faced with these initial misconceptions from their students have a tough road to hoe ahead, especially when forcing on their students fundamental linear algebra in the first two weeks of the course rather than computer code and statistical recipes.
Читать дальшеИнтервал:
Закладка:
Похожие книги на «Applied Univariate, Bivariate, and Multivariate Statistics Using Python»
Представляем Вашему вниманию похожие книги на «Applied Univariate, Bivariate, and Multivariate Statistics Using Python» списком для выбора. Мы отобрали схожую по названию и смыслу литературу в надежде предоставить читателям больше вариантов отыскать новые, интересные, ещё непрочитанные произведения.
Обсуждение, отзывы о книге «Applied Univariate, Bivariate, and Multivariate Statistics Using Python» и просто собственные мнения читателей. Оставьте ваши комментарии, напишите, что Вы думаете о произведении, его смысле или главных героях. Укажите что конкретно понравилось, а что нет, и почему Вы так считаете.
