William Kinlaw - Asset Allocation
Здесь есть возможность читать онлайн «William Kinlaw - Asset Allocation» — ознакомительный отрывок электронной книги совершенно бесплатно, а после прочтения отрывка купить полную версию. В некоторых случаях можно слушать аудио, скачать через торрент в формате fb2 и присутствует краткое содержание. Жанр: unrecognised, на английском языке. Описание произведения, (предисловие) а так же отзывы посетителей доступны на портале библиотеки ЛибКат.

- Название:Asset Allocation
- Автор:
- Жанр:
- Год:неизвестен
- ISBN:нет данных
- Рейтинг книги:3 / 5. Голосов: 1
-
Избранное:Добавить в избранное
- Отзывы:
-
Ваша оценка:
Asset Allocation: краткое содержание, описание и аннотация
Предлагаем к чтению аннотацию, описание, краткое содержание или предисловие (зависит от того, что написал сам автор книги «Asset Allocation»). Если вы не нашли необходимую информацию о книге — напишите в комментариях, мы постараемся отыскать её.
—the newly and substantially revised
of
—accomplished finance professionals William Kinlaw, Mark P. Kritzman, and David Turkington deliver a robust and insightful exploration of the core tenets of asset allocation.
Drawing on their experience working with hundreds of the world’s largest and most sophisticated investors, the authors review foundational concepts, debunk fallacies, and address cutting-edge themes like factor investing and scenario analysis. The new edition also includes references to related topics at the end of each chapter and a summary of key takeaways to help readers rapidly locate material of interest.
The book also incorporates discussions of:
The characteristics that define an asset class, including stability, investability, and similarity The fundamentals of asset allocation, including definitions of expected return, portfolio risk, and diversification Advanced topics like factor investing, asymmetric diversification, fat tails, long-term investing, and enhanced scenario analysis as well as tools to address challenges such as liquidity, rebalancing, constraints, and within-horizon risk. Perfect for client-facing practitioners as well as scholars who seek to understand practical techniques,
is a must-read resource from an author team of distinguished finance experts and a forward by Nobel prize winner Harry Markowitz.
Asset Allocation — читать онлайн ознакомительный отрывок
Ниже представлен текст книги, разбитый по страницам. Система сохранения места последней прочитанной страницы, позволяет с удобством читать онлайн бесплатно книгу «Asset Allocation», без необходимости каждый раз заново искать на чём Вы остановились. Поставьте закладку, и сможете в любой момент перейти на страницу, на которой закончили чтение.
Интервал:
Закладка:
To estimate expected returns, we start by assuming that markets are fairly priced; therefore, expected returns represent fair compensation for the degree of risk each asset class contributes to a broadly diversified market portfolio. These returns are called equilibrium returns, and we estimate them by first calculating the beta of each asset class with respect to a broad market portfolio. This calculation implicitly reflects the historical standard deviations and correlations of the assets. Next, we estimate the expected return for the market portfolio and the risk-free return. We calculate the equilibrium return of each asset class as the risk-free return plus the product of its beta and the excess return of the market portfolio. Moreover, we can easily adjust the expected return of each asset class to accord with our views about departures from fair value. Suppose we estimate the market's expected return to equal 7.5% and the risk-free return to equal 3.5%. Given these estimates, together with estimates of beta based on monthly returns from January 1976 through December 2015, we derive the equilibrium returns shown in Table 2.1.
TABLE 2.1Expected Returns
| Asset Classes | Equilibrium Returns (%) | Views (%) | Confidence (%) | Expected Returns (%) |
|---|---|---|---|---|
| US Equities | 8.8 | 8.8 | ||
| Foreign Developed Market Equities | 9.5 | 9.5 | ||
| Emerging Market Equities | 11.4 | 11.4 | ||
| Treasury Bonds | 4.1 | 4.1 | ||
| US Corporate Bonds | 4.9 | 4.9 | ||
| Commodities | 5.4 | 7.0 | 50.0 | 6.2 |
| Cash Equivalents | 3.5 | 3.5 |
Assumes 3.5% risk-free return and 4.0% market risk premium.
This approach is straightforward to implement in practice, even with more nuanced assumptions. The current risk-free return is readily observable. There are a variety of methods for estimating the expected return of a diversified market portfolio. For example, we might adjust the historical risk premium to accord with current risk levels and add this adjusted risk premium to the current risk-free return. We may expect some asset classes to produce returns that differ from those that would occur if markets were in equilibrium and perfectly integrated, especially if they are not typically arbitraged against other asset classes. Suppose we expect commodities to return 7.0% and we assign as much confidence to this view as we do to the equilibrium return. We can blend the equilibrium estimate with our view to derive expected return. The final column of Table 2.1shows the expected returns for each of the asset classes in our analysis.
Estimating Standard Deviations and Correlations
We also need to estimate the standard deviations of the asset classes as well as the correlations between each pair of asset classes. We estimate these values, shown in Table 2.2, from the monthly returns for the period beginning in January 1976 and ending in December 2015.
TABLE 2.2Standard Deviations and Correlations
| Asset Classes | Standard Deviations (%) | Correlations | ||||||
|---|---|---|---|---|---|---|---|---|
| a | b | c | d | e | f | |||
| a | US Equities | 16.6 | ||||||
| b | Foreign Developed Market Equities | 18.6 | 0.66 | |||||
| c | Emerging Market Equities | 26.6 | 0.63 | 0.68 | ||||
| d | Treasury Bonds | 5.7 | 0.10 | 0.03 | −0.02 | |||
| e | US Corporate Bonds | 7.3 | 0.31 | 0.24 | 0.22 | 0.86 | ||
| f | Commodities | 20.6 | 0.16 | 0.29 | 0.27 | −0.07 | 0.02 | |
| g | Cash Equivalents | 1.1 | 0.02 | 0.02 | 0.03 | 0.18 | 0.09 | 0.06 |
Efficient Portfolios
With this information, we use optimization to combine asset classes efficiently, so that for a given level of expected return the efficiently combined asset classes offer the lowest level of risk, measured as the standard deviation. A continuum of these portfolios plotted in dimensions of expected return and standard deviation is called the efficient frontier, as we discussed earlier.
There are a variety of methods for identifying portfolios that reside along the efficient frontier. We next describe two methods and illustrate them with a hypothetical portfolio that consists of just two asset classes: stocks and bonds.
Matrix Inversion
To begin, we define a portfolio's expected return and risk.
As noted earlier, the expected return of a portfolio is simply the weighted average of the assets' expected returns. Equation 2.1shows expected return for a portfolio consisting of only stocks and bonds:
(2.1) 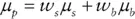
In Equation 2.1,  equals the portfolio's expected return,
  equals the expected return of stocks,
  equals the expected return of bonds,
  equals the percentage of the portfolio allocated to stocks, and
  equals the percentage allocated to bonds.
As noted earlier, portfolio risk is a little trickier. It is defined as volatility, and it is measured by the standard deviation or variance (the standard deviation squared) around the portfolio's expected return. To compute a portfolio's variance, we must consider not only the variance of the asset class returns, but also the extent to which they covary. The variance of a portfolio of stocks and bonds is computed as follows:
(2.2) 
Here  equals portfolio variance,
  equals the standard deviation of stocks,
  equals the standard deviation of bonds, and
  equals the correlation between stocks and bonds.
Our objective is to minimize portfolio risk subject to two constraints. Our first constraint is that the weighted average of the stock and bond returns must equal the expected return for the portfolio. We are also faced with a second constraint: we must allocate our entire portfolio to some combination of stocks and bonds. Therefore, the fraction we allocate to stocks plus the fraction we allocate to bonds must equal 1.
Читать дальшеИнтервал:
Закладка:
Похожие книги на «Asset Allocation»
Представляем Вашему вниманию похожие книги на «Asset Allocation» списком для выбора. Мы отобрали схожую по названию и смыслу литературу в надежде предоставить читателям больше вариантов отыскать новые, интересные, ещё непрочитанные произведения.


Обсуждение, отзывы о книге «Asset Allocation» и просто собственные мнения читателей. Оставьте ваши комментарии, напишите, что Вы думаете о произведении, его смысле или главных героях. Укажите что конкретно понравилось, а что нет, и почему Вы так считаете.