Jonathan Holslag - World Politics since 1989
Здесь есть возможность читать онлайн «Jonathan Holslag - World Politics since 1989» — ознакомительный отрывок электронной книги совершенно бесплатно, а после прочтения отрывка купить полную версию. В некоторых случаях можно слушать аудио, скачать через торрент в формате fb2 и присутствует краткое содержание. Жанр: unrecognised, на английском языке. Описание произведения, (предисловие) а так же отзывы посетителей доступны на портале библиотеки ЛибКат.
- Название:World Politics since 1989
- Автор:
- Жанр:
- Год:неизвестен
- ISBN:нет данных
- Рейтинг книги:4 / 5. Голосов: 1
-
Избранное:Добавить в избранное
- Отзывы:
-
Ваша оценка:
World Politics since 1989: краткое содержание, описание и аннотация
Предлагаем к чтению аннотацию, описание, краткое содержание или предисловие (зависит от того, что написал сам автор книги «World Politics since 1989»). Если вы не нашли необходимую информацию о книге — напишите в комментариях, мы постараемся отыскать её.
Jonathan Holslag navigates through the calm seas and rip tides of global politics from the Cold War to the present. He tells a story of faltering momentum and squandered opportunities that explains how the West’s sources of strength were lost to rising consumerism, unbalanced trade, and half-hearted diplomatic engagement. All the while, other powers, like China and Russia, grew stronger. With his trademark verve, Holslag untangles the threads of this story to reveal that it was not so much the ambition of China, the cunning of Putin, or the greed of African strongmen that led the world into this dark place; it was the failure of the West to listen to its people, to show clear leadership, and reinvent itself, in spite of ample evidence that things were going awry.
Impressive in scope and analytical depth,
is a magisterial account of how we got to where we are and what lessons can be learned from the political arrogance and complacency of the recent past.
World Politics since 1989 — читать онлайн ознакомительный отрывок
Ниже представлен текст книги, разбитый по страницам. Система сохранения места последней прочитанной страницы, позволяет с удобством читать онлайн бесплатно книгу «World Politics since 1989», без необходимости каждый раз заново искать на чём Вы остановились. Поставьте закладку, и сможете в любой момент перейти на страницу, на которой закончили чтение.
Интервал:
Закладка:
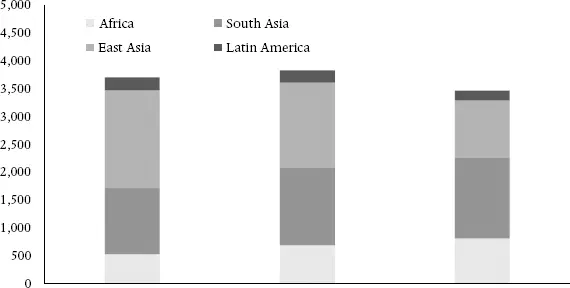
Figure 1.7 People living below US$5.2 PPP per day (million)
Source: WDI.
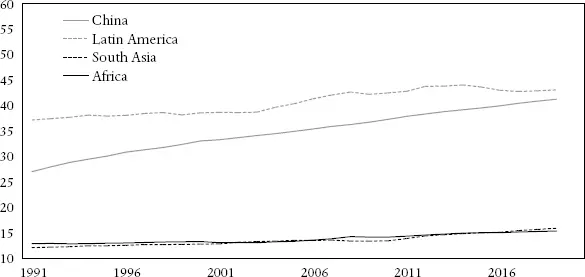
Figure 1.8 People employed as share of people between 15 and 64 years old (%)
Source: WDI.
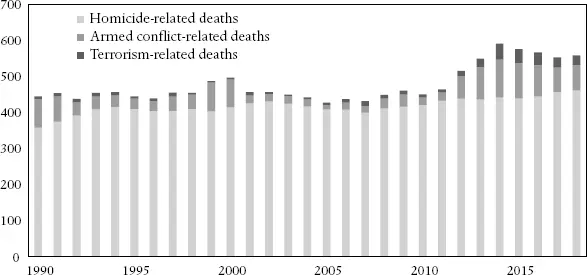
Figure 1.9 Deaths caused by homicide, armed conflicts, and terrorism (thousands)
Note: All data are approximate.
Sources: UCPD, WDI, GTD.
Security
Economic uncertainty is an incubator of insecurity. It is often argued that the world has never been safer than during the high age of globalization. This is correct. In many countries, the homicide rate, which is the number of murders compared to the total population, decreased. Compared to the brutally violent first half of the twentieth century, fewer people were killed in wars. In absolute terms, however, the number of people killed by violence slightly increased, particularly between 2010 and 2019 (figure 1.9). Organized crime, rebellion, and terrorism infested large parts of the world. There can be discussion about the degree to which, for instance, murders and terrorist incidents are now more frequently reported. The fact remains that over half a million people were killed by violence each year. In relation to the population, the death rate dropped. Yet still, many people lived in the dark shadow of endemic violence.
Figure 1.10 shows that globalization has not advanced security throughout the world. Between 1990 and 2004, the number of armed conflicts decreased, but rebounded in the following 15 years. The number of wars remained small. The most lethal wars were those in the Democratic Republic of Congo, Rwanda, Syria, Sudan, Afghanistan, and Iraq. Many of these conflicts were protracted and lasted many years, so that international attention diminished. Highlighting the increase in conflict is the number of forcibly displaced people. These include refugees and people who are forced to leave their home but remain inside the country. Between 2004 and 2017, the number of forcibly displaced people more than doubled. The majority were located in Africa and the Middle East.
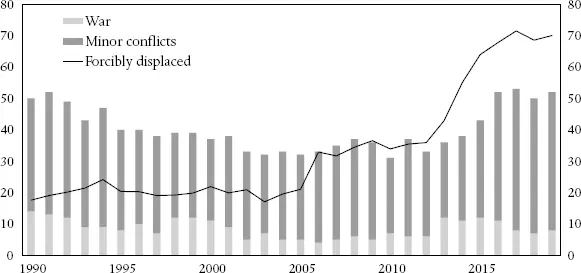
Figure 1.10 Number of armed conflicts (left axis) and forcibly displaced people (million, right axis)
Note: Major wars have at least 1,000 battle-related deaths.
Source: UCPD.
Global military spending, calculated in constant American dollars, also bounced back to Cold War levels (figure 1.11). Most countries reduced the number of soldiers, but spent much more on modern weapons systems. The United States intervened in Afghanistan and Iraq. The Western global war on terror became one of the most expensive military campaigns in recent history. Russia used military force to repel the West from what was left of the Soviet sphere of influence. China embarked on a massive military build-up to drive the United States out of its adjacent seas. Thousands of ballistic missiles were deployed as a cheap deterrent against US naval prowess. Major geopolitical tensions resurfaced between close trading partners, like China and the United States, and Russia and Western Europe.
Figure 1.11 Global military spending (constant US$ bn)
Source: SIPRI.
Environment
Citizens were consistently concerned about pollution. In 1990, long before Greta Thunberg started the school strike against climate change, hundreds of thousands of protesters gathered on the Mall in Washington, DC to celebrate Earth Day. Movie star Tom Cruise addressed them: “We see many walls come tumbling down this year. With the walls down, we can all see what we have in common: our planet.” 4
That same year, a Swiss physicist proposed to mitigate global warming by putting a mirror in space to deflect the sun’s heat. “How to solve the CO2 problem without tears,” scientists challenged themselves. 5In 1993, Bill Clinton was one of the first presidential candidates in the United States to embrace climate change and the environment as key themes in his campaign. But the CO 2problem was not solved. Since 1990, CO 2emissions grew by about 70 percent and the CO 2efficiency of the world economy hardly increased (figure 1.12).
Or consider transportation. Globalization was often said to be a more efficient way of production. But one factor that was seldom considered in measuring its success concerned transportation. Transportation is a key emitter of polluting gases, but it also causes traffic jams and requires a lot of space for roads, warehouses, and so forth. Between 1990 and 2019, figure 1.13 shows, the global economy became significantly less efficient in terms of transportation. There were thus more ships, container stacks, trucks, vans, and warehouses for smaller gains in production.
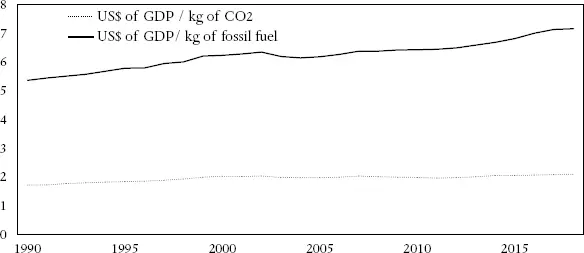
Figure 1.12 Fueling economic growth: Global US$ of GDP per kg of CO 2emitted and kg of fossil fuel consumed (kg/constant 2010 US$)
Source: WDI.
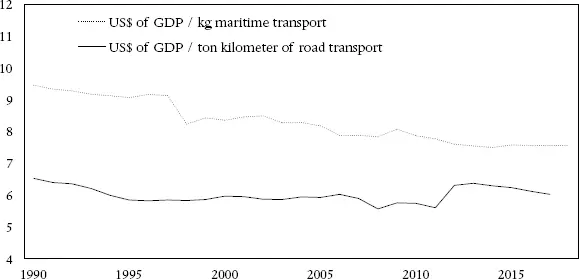
Figure 1.13 Global US$ of GDP per kg of transport (kg/constant 2010 US$)
Source: WDI.
A final indicator that hints at the limited impact of innovation and technology is the disposal of waste. We do not have consistent data for the total global waste pile. We do know that the disposed waste in European countries decreased, that it remained stable in the United States, and that it increased spectacularly in many developing countries. We do have data, however, for global plastic waste, summarized in figure 1.14. While recycling of plastic waste was almost negligible in the early 1990s, the global share of reused plastic waste climbed to slightly below a quarter in 2020. Yet, the total disposed plastic waste, burned or put into landfill, almost trebled. Overall, the world economy became less, not more, economical in using plastics. The global production per kilogram of plastic waste decreased in the 1990s and remained flat in the following two decades.
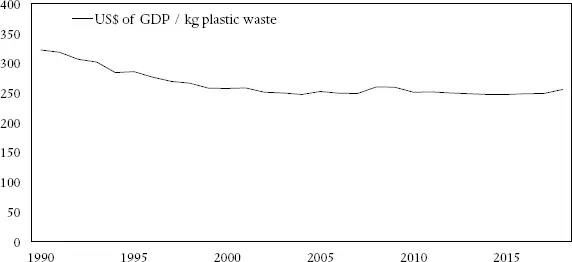
Figure 1.14 GDP per kg plastic waste (kg/constant 2010 US$)
Source: WDI and UN Baseline Report on Plastic Waste.
Perspective
In sum, the question is not so much whether there has been progress in the post-Cold War period. The question is rather how we evaluate the degree of progress in spreading democracy, social dignity, security, and sustainable production in comparison to the spectacular high tide of economic globalization, the opportunity to exchange technology and ideas, and so forth. Progress optimists often magnify the positive trend by comparing everything with the growing world population. Compared with the growing world population, fewer people get killed. Compared with the growing world population, one can mitigate many trends. But if we really care about progress, it is fairer to ask whether we advanced enough in comparison with to the economic opportunities that were present than to ask whether we advanced in comparison with the number of people that live on the planet. From that perspective, many curves remained remarkably flat.
Читать дальшеИнтервал:
Закладка:
Похожие книги на «World Politics since 1989»
Представляем Вашему вниманию похожие книги на «World Politics since 1989» списком для выбора. Мы отобрали схожую по названию и смыслу литературу в надежде предоставить читателям больше вариантов отыскать новые, интересные, ещё непрочитанные произведения.
![Деннис Лихэйн - Когда под ногами бездна [Since We Fell ru]](/books/25722/dennis-lihejn-kogda-pod-nogami-bezdna-since-we-fe-thumb.webp)


Обсуждение, отзывы о книге «World Politics since 1989» и просто собственные мнения читателей. Оставьте ваши комментарии, напишите, что Вы думаете о произведении, его смысле или главных героях. Укажите что конкретно понравилось, а что нет, и почему Вы так считаете.