Jonathan Holslag - World Politics since 1989
Здесь есть возможность читать онлайн «Jonathan Holslag - World Politics since 1989» — ознакомительный отрывок электронной книги совершенно бесплатно, а после прочтения отрывка купить полную версию. В некоторых случаях можно слушать аудио, скачать через торрент в формате fb2 и присутствует краткое содержание. Жанр: unrecognised, на английском языке. Описание произведения, (предисловие) а так же отзывы посетителей доступны на портале библиотеки ЛибКат.
- Название:World Politics since 1989
- Автор:
- Жанр:
- Год:неизвестен
- ISBN:нет данных
- Рейтинг книги:4 / 5. Голосов: 1
-
Избранное:Добавить в избранное
- Отзывы:
-
Ваша оценка:
World Politics since 1989: краткое содержание, описание и аннотация
Предлагаем к чтению аннотацию, описание, краткое содержание или предисловие (зависит от того, что написал сам автор книги «World Politics since 1989»). Если вы не нашли необходимую информацию о книге — напишите в комментариях, мы постараемся отыскать её.
Jonathan Holslag navigates through the calm seas and rip tides of global politics from the Cold War to the present. He tells a story of faltering momentum and squandered opportunities that explains how the West’s sources of strength were lost to rising consumerism, unbalanced trade, and half-hearted diplomatic engagement. All the while, other powers, like China and Russia, grew stronger. With his trademark verve, Holslag untangles the threads of this story to reveal that it was not so much the ambition of China, the cunning of Putin, or the greed of African strongmen that led the world into this dark place; it was the failure of the West to listen to its people, to show clear leadership, and reinvent itself, in spite of ample evidence that things were going awry.
Impressive in scope and analytical depth,
is a magisterial account of how we got to where we are and what lessons can be learned from the political arrogance and complacency of the recent past.
World Politics since 1989 — читать онлайн ознакомительный отрывок
Ниже представлен текст книги, разбитый по страницам. Система сохранения места последней прочитанной страницы, позволяет с удобством читать онлайн бесплатно книгу «World Politics since 1989», без необходимости каждый раз заново искать на чём Вы остановились. Поставьте закладку, и сможете в любой момент перейти на страницу, на которой закончили чтение.
Интервал:
Закладка:
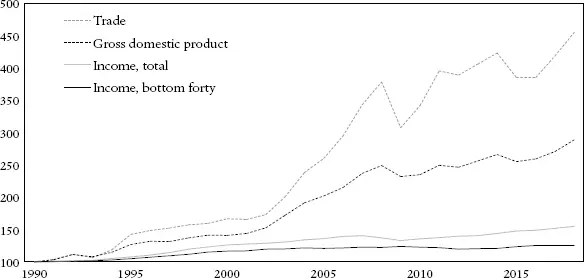
Figure 1.2 Selected growth indicators for the West (%)
Note: Figures for EU28 and US. All income figures are inflation-adjusted. The income figures for the bottom 40 concern the unweighted average of real disposable incomes for the US, the UK, France, and Germany.
Sources: WDI, BEA, SOEP, INSEE.
Western countries experienced a decline of their power and a growing gap between economic growth and purchasing power. The full impact of this weakening was mitigated by growing external debt. The majority of Western countries imported more than they exported. Later, we will discover that these imports primarily concern fuels from Russia and the Gulf States, consumer goods from China, and cars alongside other machines from Germany. If we accumulate the current account deficit throughout the three decades, it amounts to US$14 trillion, five times the size of the economy of the United Kingdom (figure 1.3). The current account includes trade and investment incomes. Germany and the Netherlands were key exceptions with large surpluses. Large, structural deficits can spark painful adjustment crises in the long run. Think of the tale by Jean de La Fontaine, about the ant and the grasshopper. When the cold winter kicks in and the industrious ant is not willing to help, the vulnerability of the grasshopper becomes visible.
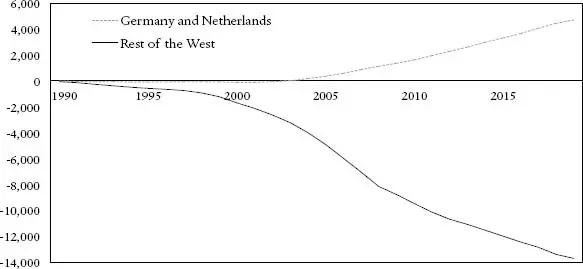
Figure 1.3 The evolution of the net international investment position (US$ bn)
Note: US and EU countries. Germany and the Netherlands are set apart given their exceptionally large surplus.
Source: WDI.
The limits of globalization
The erosion of economic power notwithstanding, the West remained an important consumer market. In the 1990s, a core foreign policy theme was conditional engagement: access to the Western market in exchange for accepting Western rules and values, including free trade, democracy, and the rule of law. Striking, however, was that the countries profiting the most from the age of globalization and the openness of the West were not the democratic countries.
Authoritarian countries, especially China, rapidly expanded their share in Western imports from 15 percent in 1990 to 34 percent in 2012 (figure 1.4). The countries growing their export revenues from the West the most were thus not necessarily free, democratic countries, but often authoritarian countries. Conditional engagement was self-deception.
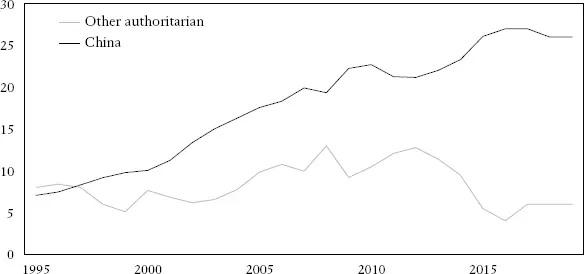
Figure 1.4 Share of authoritarian countries in total imports of EU and US (%, EU is extra-EU)
Note: Coding for authoritarianism based on World Governance Indicators (accountability and rule of law).
Sources: WGI and UNCTAD.
Figure 1.5 shows that economic openness advanced between 1990 and 2010. Afterwards, its advance slowed significantly and even tapered off. More remarkable is the fact that political openness hardly increased during these 30 years. Of all the countries in the world, at most 46 percent could be defined as free. Of all the people in the world, at most 40 percent lived in a liberal democracy. The peak of democratization was around 2008. Afterwards, not only did economic globalization stagnate, but democracy receded slowly as well. There is thus not much evidence that globalization promoted democracy in the world. Economic openness, if it ever truly existed, did not lead to political openness. Still, this tune was repeated by Western politicians again and again.
While the world was celebrating the high age of globalization, even physical walls returned. Altogether, over 13,000 kilometers of walls and border fences were built between 1990 and 2019 (figure 1.6). By comparison, the Berlin Wall was just 155 kilometers long; the whole Iron Curtain, the fault line between the Soviet Union and the West, was about 6,800 kilometers. Walls have emerged in every region: Europe, Asia, Africa, and the Americas. The idea that commerce would level out borders and barriers has thus not materialized. Nationalism never entirely vanished. Memories of previous wars and territorial disputes continued to hang as a dark shadow over trading states like China, South Korea, and Japan. In Europe, despite decades of integration, center politicians continued to struggle with nationalist parties and the vast majority of citizens still identified themselves more as national citizens than as European ones.
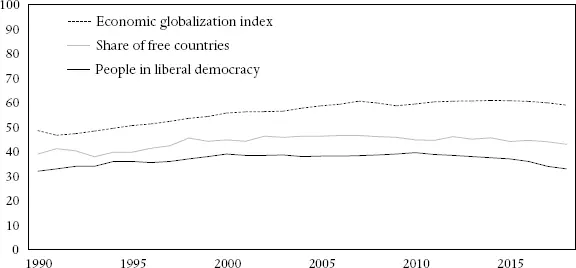
Figure 1.5 Economic and political globalization: economic globalization index, share of free countries, and share of world population living in liberal democracies (%)
Sources: KOF, Freedom House, Anna Lührmann, Sandra Grahn, Richard Morgan, Shreeya Pillai, and Staffan I. Lindberg, 2019. State of the world 2018: Democracy facing global challenges. Democratization , 26(6), 895–915.
China vs Global South
During the early post-Cold War period, there was enthusiasm about the rise of the Global South, about Africa, South Asia, and Latin America. But this area was eclipsed by China. China’s growth was the fruit of the hard work of hundreds of millions of citizens and a government that did a better job in attracting the foreign investment that came with technology and experience. This had important consequences.
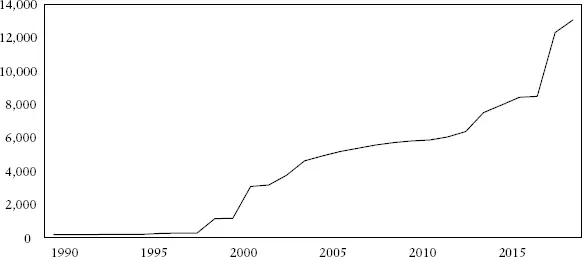
Figure 1.6 Accumulated length of border fences and walls (km)
Source: Verified news sources. For instance: India building new “steel fence” along Pakistan, Bangla borders. Economic Times , January 10, 2020; Tom Head, 2020. SA’s new R37m border fence with Zimbabwe badly damaged. The South Africa , April 13, 2020; Ilan Greenberg, 2006. Kazakhstan: Fence for part of Uzbek border. The New York Times , October 20, 2006.
The Global South remained beset by poverty. The World Bank stressed that the $1.90 poverty threshold is too low to measure economic distress and proposed higher thresholds. Figure 1.7 shows the number of people below the threshold of US$5.2 per day. US$5.2 per day barely covers food purchases and basic needs. It is not extreme poverty, but it remains poverty. The number of people in the Global South, Africa, Latin America, and South Asia living below this threshold grew by about 500 million.
A critical problem for the Global South concerned the limited availability of jobs. Once more, the difference from China was striking. Between 1990 and 2019, China’s population between 15 and 64 years of age increased by 245 million. At the same time, it created 207 million additional jobs. Between 1990 and 2019, the combined population between 15 and 64 years of age in Africa and South Asia increased by 870 million. But the total number of jobs only increased by 170 million. In 2019, 16 percent of the South Asian population between 15 and 64 years was employed, 15 percent in Africa. Many thus remained dependent on self-employment in agriculture or informal employment in cities (figure 1.8). Yet, subsistence farming in the agricultural sector was threatened by climate change, water shortage, and cheap products exported by the West, and the informal sector in the cities by inflation, crime, and cheaper goods dumped from China.
Читать дальшеИнтервал:
Закладка:
Похожие книги на «World Politics since 1989»
Представляем Вашему вниманию похожие книги на «World Politics since 1989» списком для выбора. Мы отобрали схожую по названию и смыслу литературу в надежде предоставить читателям больше вариантов отыскать новые, интересные, ещё непрочитанные произведения.
![Деннис Лихэйн - Когда под ногами бездна [Since We Fell ru]](/books/25722/dennis-lihejn-kogda-pod-nogami-bezdna-since-we-fe-thumb.webp)


Обсуждение, отзывы о книге «World Politics since 1989» и просто собственные мнения читателей. Оставьте ваши комментарии, напишите, что Вы думаете о произведении, его смысле или главных героях. Укажите что конкретно понравилось, а что нет, и почему Вы так считаете.