Istvan Urban - Vertical 2 - The Next Level of Hard and Soft Tissue Augmentation
Здесь есть возможность читать онлайн «Istvan Urban - Vertical 2 - The Next Level of Hard and Soft Tissue Augmentation» — ознакомительный отрывок электронной книги совершенно бесплатно, а после прочтения отрывка купить полную версию. В некоторых случаях можно слушать аудио, скачать через торрент в формате fb2 и присутствует краткое содержание. Жанр: unrecognised, на английском языке. Описание произведения, (предисловие) а так же отзывы посетителей доступны на портале библиотеки ЛибКат.
- Название:Vertical 2: The Next Level of Hard and Soft Tissue Augmentation
- Автор:
- Жанр:
- Год:неизвестен
- ISBN:нет данных
- Рейтинг книги:4 / 5. Голосов: 1
-
Избранное:Добавить в избранное
- Отзывы:
-
Ваша оценка:
Vertical 2: The Next Level of Hard and Soft Tissue Augmentation: краткое содержание, описание и аннотация
Предлагаем к чтению аннотацию, описание, краткое содержание или предисловие (зависит от того, что написал сам автор книги «Vertical 2: The Next Level of Hard and Soft Tissue Augmentation»). Если вы не нашли необходимую информацию о книге — напишите в комментариях, мы постараемся отыскать её.
A major part of this book comprises full-color, step-by-step images of patient cases. At times, reading it is like watching a surgical video, where the author 'stops the video' to discuss with you, the reader, what he is thinking and doing at that step, what his next step will be, and the reason for it.
Included again are the well-appreciated 'Lessons learned' sections, where the learning objectives are emphasized and further notes given, including ways to further improve the techniques. The section on the mandible is more detailed in this book, with the focus on larger defects and the different surgical steps in native, fibrotic, and scarred tissue types around the mental nerve during flap advancement.
In addition, light is shed on the detail in treating the anterior maxilla, which has not been published previously. It includes treatment options such as the fast track, the safe track, and the technical track of soft tissue reconstruction in conjunction with bone grafting as well as papilla reconstructions after bone regeneration. The section on the posterior maxilla hopes to resolve issues such as the management and complications of combined ridge and sinus grafting, including difficulties such as the lack of buccal, crestal or nasal bony walls of the posterior maxilla before bone grafting.
In this must-have new publication, the procedures are kept simple, repeatable, and biologically sound. The techniques presented are not overcomplicated; they are simple treatment strategies with lower complication rates and more predictability in the final outcome.
Vertical 2: The Next Level of Hard and Soft Tissue Augmentation — читать онлайн ознакомительный отрывок
Ниже представлен текст книги, разбитый по страницам. Система сохранения места последней прочитанной страницы, позволяет с удобством читать онлайн бесплатно книгу «Vertical 2: The Next Level of Hard and Soft Tissue Augmentation», без необходимости каждый раз заново искать на чём Вы остановились. Поставьте закладку, и сможете в любой момент перейти на страницу, на которой закончили чтение.
Интервал:
Закладка:
Statistical analysis
Logistic regression using generalized estimation equations (GEE) were conducted to assess vertical bone gain differences and the probability of complete relative bone gain according to positional variables. Models were adjusted for defect size, healing time, age, and smoking; beta coefficients, odds ratio, and 95% confidence intervals (CIs) using the Wald chi-square test were calculated. The significance level was set at 5% (α = 0.05).
A pos-thoc power analysis determined that a sample size of 65 independent sites providing 85.1% power with 95% confidence for detecting mean gains of 4.5 and 6.0 mm was significantly different using linear regression. However, as not all sites were independent, a power correction was necessary. Each patient provided a mean of 1.14 sites, and a high within-subject correlation (CCI = 0.9) was assumed, leading to a correcting coefficient of D = 1.13. Therefore, 65 dependent sites provided the same power as 58 independent ones (80.1%).
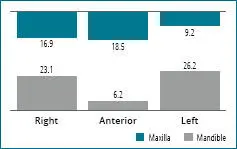
Fig 2-1 Distribution of defects (%) by site.
Results
Patient characteristics
The sample included 57 patients (65 defects) who underwent VBA using RPM. A total of 21 males (36.8%) and 36 females (63.2%) with a mean age of 51.9 ± 11.8 years (range: 28 to 78 years) were included. Each patient received surgery in one (86%) or two (14%) different sites. Of the total patients, 96.5% were nonsmokers; two patients were smokers. Demographic, clinical, and defect distribution characteristics are shown in Table 2-1, and defect distribution is further described in Figure 2-1.
Bone gain analysis
Table 2-2and Figure 2-2aand bdocument ridge height changes post-VBA.
The mean baseline vertical deficiency was 5.5 ± 2.6 mm. The absolute gain in vertical dimension from VBA was 5.2 ± 2.4 mm, corresponding to a mean relative height gain of 96.5 ± 13.9%; 89.2% of the sites presented complete regeneration, i.e. elimination of vertical deficiency. Each 1-month addition to the healing time increased the relative gain by 1.34%.
Table 2-1 Demographic and clinical characteristics of the studied cohort
| N (%) / mean ± SD | ||
| Patient Level | N patients | 57 |
| Age (years) | 51.9 ± 11.8 | |
| Gender | ||
| Male | 21 (36.8) | |
| Female | 36 (63.2) | |
| Smoker | ||
| No | 55 (96.5) | |
| Yes | 2 (3.5) | |
| N sites on surgery | ||
| 1 | 49 (86.0) | |
| 2 | 8 (14.0) | |
| Site level | N sites | 65 |
| Site | ||
| Maxillary anterior | 12 (18.5) | |
| Maxillary right posterior | 11 (16.9) | |
| Maxillary left posterior | 6 (9.2) | |
| Mandibular anterior | 4 (6.2) | |
| Mandibular right posterior | 15 (23.1) | |
| Mandibular left posterior | 17 (26.2) | |
| N implants | ||
| 0 | 3 (4.6) | |
| 1 | 7 (10.8) | |
| 2 | 34 (52.3) | |
| 3 | 20 (30.8) | |
| 4 | 1 (1.5) | |
| Healing time (months) | 9.7 ± 3.3 | |
| Complications | ||
| None | 63 (97) | |
| Exposure | 1 (1.5) | |
| Infection | 1 (1.5) | |
| Defect type | ||
| Vertical | 65 (100) | |
| Defect size (mm) | 5.5 ± 2.6 | |
| N missing teeth | 3.2 ± 1.2 | |
| Maxilla | 3.1 ± 1.5 | |
| Mandible | 3.2 ± 0.9 | |
| N: number (of patients or sites as a percentage); SD: standard deviation |
Table 2-2 Changes in the dimensional parameters of the defects after bone augmentation
| Vertical | 5.5 ± 2.6 | 5.2 ± 2.4 | 96.5 ± 13.9 | 89.2 |
Table 2-3 Multiple linear regression analysis on the relative vertical gain (%) controlling for defect size, arch, healing time, and age
| Regression coefficient | 95% CI | P value | |
| Defect size | < 0.001*** | ||
| < 5 mm (reference) | 0.00 | ||
| 5–8 mm | –5.97 | -11.8 to 0.13 | 0.045* |
| > 8 mm | –11.9 | -17.8 to 5.89 | < 0.001*** |
| Arch | |||
| Maxilla (reference) | 0.00 | ||
| Mandible | –2.98 | -8.01 to 2.05 | 0.246 |
| Healing time | 1.34 | 0.08 to 2.60 | 0.037* |
| Age | 0.08 | -0.05 to 0.21 | 0.207 |
| CI: confidence interval * P < 0.5 *** P < 0.001 |
Influence of baseline vertical deficiency on absolute and relative bone gain
Six defects out of 65 were not completely regenerated. Five of these sites had baseline vertical deficiencies of ≥ 10 mm ( Fig 2-3a), and one site with a 6-mm baseline deficiency was infected postoperatively. The probability of achieving complete regeneration was inversely proportional to defect size ( P = 0.005). Each 1-mm addition to baseline height deficiency increased the likelihood of incomplete bone regeneration by 2.5 times. Having a baseline deficiency of 5 to 8 mm reduced the relative gain by 6% compared with having a baseline deficiency of < 5 mm ( P = 0.045). Having a baseline deficiency of > 8 mm reduced the relative bone gain by 12% compared with having a baseline deficiency < 5 mm ( P < 0.001) ( Fig 2-3b). Multiple linear regression controlling for defect size, arch, healing time, and age ( Table 2-3(identified healing time to be a significant factor affecting vertical growth ( P = 0.037).
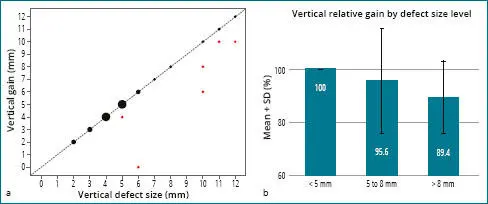
Fig 2-2 (a) Correlation between defect size and vertical gain. The red dots represent cases that were not completely regenerated; five such cases had baseline vertical deficiencies measuring ≥ 10 mm. One defect with a base-line deficiency of 6 mm showed a null gain. (b) Relative vertical gain according to baseline deficiency (SD = standard deviation).
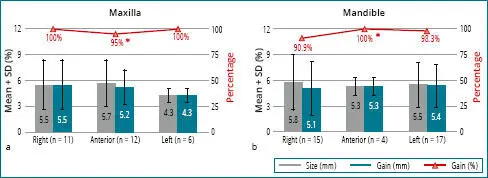
Fig 2-3 Absolute and relative vertical gain in the (a) maxilla, and (b) mandible (SD = standard deviation).
Influence of defect location on absolute bone gain: maxilla vs mandible
There were 29 maxillary and 36 mandibular defects treated in our study. The baseline mean vertical deficiency was 5.3 ± 2.5 mm in the maxilla and 5.6 ± 2.7 mm in the mandible; there was no difference in this variable between the arches per GEE ( P = 0.664). Mean absolute vertical bone gain was 5.1 ± 2.2 mm in the maxilla and 5.3 ± 2.6 mm in the mandible; there was no difference in this variable between the arches per multiple linear regression ( P = 0.596) ( Table 2-4). Defect size ( P < 0.01) and healing time ( P < 0.05) significantly affected vertical gain. Smoking was not statistically relevant ( P = 0.220), but a large effect size (beta = 1.60) was observed.
Читать дальшеИнтервал:
Закладка:
Похожие книги на «Vertical 2: The Next Level of Hard and Soft Tissue Augmentation»
Представляем Вашему вниманию похожие книги на «Vertical 2: The Next Level of Hard and Soft Tissue Augmentation» списком для выбора. Мы отобрали схожую по названию и смыслу литературу в надежде предоставить читателям больше вариантов отыскать новые, интересные, ещё непрочитанные произведения.


Обсуждение, отзывы о книге «Vertical 2: The Next Level of Hard and Soft Tissue Augmentation» и просто собственные мнения читателей. Оставьте ваши комментарии, напишите, что Вы думаете о произведении, его смысле или главных героях. Укажите что конкретно понравилось, а что нет, и почему Вы так считаете.