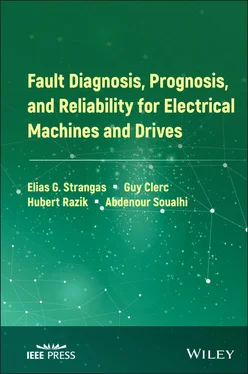
Abdenour Soualhi - Fault Diagnosis, Prognosis, and Reliability for Electrical Machines and Drives
Здесь есть возможность читать онлайн «Abdenour Soualhi - Fault Diagnosis, Prognosis, and Reliability for Electrical Machines and Drives» — ознакомительный отрывок электронной книги совершенно бесплатно, а после прочтения отрывка купить полную версию. В некоторых случаях можно слушать аудио, скачать через торрент в формате fb2 и присутствует краткое содержание. Жанр: unrecognised, на английском языке. Описание произведения, (предисловие) а так же отзывы посетителей доступны на портале библиотеки ЛибКат.
- Название:Fault Diagnosis, Prognosis, and Reliability for Electrical Machines and Drives
- Автор:
- Жанр:
- Год:неизвестен
- ISBN:нет данных
- Рейтинг книги:5 / 5. Голосов: 1
-
Избранное:Добавить в избранное
- Отзывы:
-
Ваша оценка:
- 100
- 1
- 2
- 3
- 4
- 5
Fault Diagnosis, Prognosis, and Reliability for Electrical Machines and Drives: краткое содержание, описание и аннотация
Предлагаем к чтению аннотацию, описание, краткое содержание или предисловие (зависит от того, что написал сам автор книги «Fault Diagnosis, Prognosis, and Reliability for Electrical Machines and Drives»). Если вы не нашли необходимую информацию о книге — напишите в комментариях, мы постараемся отыскать её.
An insightful treatment of present and emerging technologies in fault diagnosis and failure prognosis Fault Diagnosis, Prognosis, and Reliability for Electrical Machines and Drives,
Fault Diagnosis, Prognosis, and Reliability for Electrical Machines and Drives
Fault Diagnosis, Prognosis, and Reliability for Electrical Machines and Drives
Fault Diagnosis, Prognosis, and Reliability for Electrical Machines and Drives — читать онлайн ознакомительный отрывок
Ниже представлен текст книги, разбитый по страницам. Система сохранения места последней прочитанной страницы, позволяет с удобством читать онлайн бесплатно книгу «Fault Diagnosis, Prognosis, and Reliability for Electrical Machines and Drives», без необходимости каждый раз заново искать на чём Вы остановились. Поставьте закладку, и сможете в любой момент перейти на страницу, на которой закончили чтение.
Интервал:
Закладка:
11 3 Fault Diagnosis and Prognosis for Reliability Enhancement 3.1 Introduction3.2 Fundamentals3.2.1 The Pattern of Failures with Time for Non-Repairable Items3.2.2 Distribution Functions3.2.3 Confidence in Reliability and Prognosis3.3 Component Reliability3.4 Reliability of Subsystems and Systems3.4.1 Analysis Tools3.5 Lifetime, Reliability Prediction3.6 Fault Management and Mitigation3.7 Design and Manufacturing3.8 Applications and Case Studies3.9 Scheduled Maintenance, Condition-Based Maintenance3.9.1 Reliability and Costs3.10 ConclusionsBibliography
12 Index
List of Illustrations
1 Chapter 1Figure 1.1 General overview of Diagnosis and Prognosis methodsFigure 1.2 Application fields for sensorsFigure 1.3 AccelerometerFigure 1.4 Axial flux distribution in an induction motor and possible distributionFigure 1.5 Lobar polar patternFigure 1.6 Direct current generator @LeroySomerFigure 1.7 Pulse angular speed tachometerFigure 1.8 Incremental encoderFigure 1.9 Numeric Grey absolute encoderFigure 1.10 Synchro-resolverFigure 1.11 The trajectory of the line current: the motor operates under ...Figure 1.12 The spectrum of the line current: the motor operates under one ...Figure 1.13 The Hann windowFigure 1.14 The Hamming windowFigure 1.15 The Blackman windowFigure 1.16 Spectrum without windowFigure 1.17 Spectrum using the Hamming windowFigure 1.18 Spectrum using the Hann windowFigure 1.19 Spectrum using the Blackman windowFigure 1.20 Spectra on the range 40–60HzFigure 1.21 Rules of transformation between the time–frequency and...Figure 1.22 Stationary signal example (Bonnardot [2004])Figure 1.23 Estimation of the parametersFigure 1.24 Estimation of the parametersFigure 1.25 ObserverFigure 1.26 Extended rotor resistance observerFigure 1.27 Unscented Kalman Filter Algorithm ...Figure 1.28 Iris data base (a) initial values (b) after PCA.Figure 1.29 Pearson coefficient Source: Tufféry [2012] and Ben Marzoug [2020]Figure 1.30 Difference between Pearson and Spearman coefficients Source...Figure 1.31 Sequential backward feature selectionFigure 1.32 Sequential forward feature selectionFigure 1.33 Inertia explained by axesFigure 1.34 Confusion matrix after a discriminant analysis of Fisher’s iris dataFigure 1.35 Illustration of Huygens relationFigure 1.36 General process of classificationFigure 1.37 Examples of supervised clusteringFigure 1.38 Examples of unsupervised clusteringFigure 1.39 Isovalues of Euclidean (circles) and Mahalanobis (ellipse) distances...Figure 1.40 kNN rules applied to a new observationFigure 1.41 Class overlapFigure 1.42 Binary SVMFigure 1.43 A basic neural network with one hidden layerFigure 1.44 Optimization process of a basic neural networkFigure 1.45 A basic recurrent neural networkFigure 1.46 A basic neural network for faults detectionFigure 1.47 Example of a dendrogramFigure 1.48 Chain effectFigure 1.49 K-means algorithm for the partitioning of two classesFigure 1.50 Architecture of a self-organizing map (1D network)Figure 1.51 Evolution of the learning rate over timeFigure 1.52 Prognosis methods (Soualhi et al. [2020]) with the permission of ...Figure 1.53 Prognosis processFigure 1.54 Hybrid Prognostics approach. (Pecht and Jaai [2010])...Figure 1.55 Example of time series with monthly counts of airline passengers...Figure 1.56 Example of the trend and seasonability of a time series (MATLAB [2020])Figure 1.57 Example of a time series moving average filtering (MATLAB [2020])Figure 1.58 Example of ARIMA model (MATLAB [2020])Figure 1.59 Naive Bayesian networkFigure 1.60 Augmented naive Bayesian networkFigure 1.61 Different cases for the rainflow algorithmFigure 1.62 Example of the rainflow algorithm (Lee and Tjhung [2012])
2 Chapter 2Figure 2.1 Motor Drive overview.Figure 2.2 Diagnosis Test bench for synchronous machine in...Figure 2.3 Chevrolet Spark Electric Vehicle Electric Induction Motor, GMS.Figure 2.4 Chevrolet Spark Electric Vehicle Electric Permanent Magnet AC...Figure 2.5 Hysteresis curve with minor loops.Figure 2.6 Demagnetization characteristics of rare earth magnets.Figure 2.7 Demagnetization characteristics of NdFeB (Neodymium Iron Boron).Figure 2.8 Types of distributed windings. (a) Single layer distributed stator...Figure 2.9 Types of concentrated windings. (a) Double layer distributed stator...Figure 2.10 Stator slot designs.Figure 2.11 Interior and Surface Permanent Magnet Machines...Figure 2.12 Induction machine rotor.Figure 2.13 Schematic of Field Oriented torque control of an induction machineFigure 2.14 Schematic of flux and voltage sectors for Direct Torque Control.Figure 2.15 Schematic of Direct Torque Control Concept for Induction Machines.Figure 2.16 Typical cross sections of radial flux PMAC machines...Figure 2.17 Failure distribution of Low and Medium Power Motors...Figure 2.18 Failure distribution of High power motors for petrochemistryFigure 2.19 Stray flux and measurement positions Ceban et al. (2012).Figure 2.20 Classification based on TFR by A. Lebaroud, Lebaroud and Clerc (2008).Figure 2.21 Sensor fault indicators, Zhang et al. (2020).Figure 2.22 Integrated Prognosis Algorithm for Electric Drive Systems...Figure 2.23 Bearing geometry.Figure 2.24 Effect of crates in the transient signal,...Figure 2.25 SNRs of the denoised signals from the SOS-based and SOSO based...Figure 2.26 Feature trends of selected features Kim et al. (2012).Figure 2.27 Probability distribution of each health state Kim et al. (2012).Figure 2.28 Comparison of actual RUL and estimated RUL Kim et al. (2012).Figure 2.29 Neural network and HMM prognosis from Soualhi et al..Figure 2.30 Curve fitting to variance and entropy features...Figure 2.31 RUL estimation with different EKF tracking start times Singleton...Figure 2.32 RUL estimation with the variance feature...Figure 2.33 Observations, micro-states and macro states Ma et al. (2020).Figure 2.34 The framework of the proposed GMM-SR-HSMM approach. Ma et al. (2020).Figure 2.35 The calculation of remaining life for each state. Ma et al. (2020).Figure 2.36 RUL prediction using based on the SR feature Ma et al. (2020).Figure 2.37 Overview of materials in a low-voltage insulation system...Figure 2.38 RUL estimate using peak-to-peak value of the switching current...Figure 2.39 Experiment equipment setup, Tsyokhla et al. (2019)...Figure 2.40 Insulation frequency-dependent characteristics...Figure 2.41 Equivalent capacitance and RUL estimation...Figure 2.42 Partial discharges in voids.Figure 2.43 Separation of PD from commutation disturbance in motors using...Figure 2.44 Open circuit faults: a. Parallel coils in a phase...Figure 2.45 First harmonic magnitude analysis after data regularization...Figure 2.46 Analysis of time harmonic magnitudes in space.Figure 2.47 Framework for diagnosis and prognosis of electrical machines...Figure 2.48 Triggering of fault parameter estimation when fault occurs or changes...Figure 2.49 DC Simulation of the field in healthy...Figure 2.50 Simulated current in the stator frame before and after...Figure 2.51 Numerical analysis of stresses and displacements after a broken bar...Figure 2.52 Three-phase rotor resistance with and without broken bars...Figure 2.53 Comparison between simulation and experimental results for...Figure 2.54 Location of Hall sensor installed for FE and experimental ...Figure 2.55 Experimental results for three IPMSM faults, Park et al...Figure 2.56 RFOC strategy with SVM applied to the PMSM-side converterFigure 2.57 Block diagram of the DTC strategy applied to the PMSM..Figure 2.58 Ray ratios and IRP ratios for online ITSCs detection under different...Figure 2.59 Current and voltage ratios and Ray ratios (a) and online...Figure 2.60 Five typical fault-isolation schemes, Zhang et al. (2014).Figure 2.61 Three-phase open circuit tolerant drives Zhang et al. (2014).Figure 2.62 Three possible configurations for stator windings of a...Figure 2.63 Open-circuit faults in phase windings of a five-phase motor...Figure 2.64 Power electronic source of tresses.Figure 2.65 Power converter failure distribution.Figure 2.66 Motor Drive.Figure 2.67 Three-Phase Diode Rectifier.Figure 2.68 Three Phase Diode Rectifier.Figure 2.69 Three Phase Thyristor Rectifier.Figure 2.70 Three phase thyristor rectifier waves.Figure 2.71 Three Phase Inverter.Figure 2.72 PWM Output Voltage.Figure 2.73 PWM principle.Figure 2.74 𝛼-𝛽 representation of the vector limits.Figure 2.75 Representation of the switching times...Figure 2.76 MOSFET Switching characteristic.Figure 2.77 N-MOSFET Horizontal Structure.Figure 2.78 N-MOSFET behaviour.Figure 2.79 N-MOSFET CharacteristicFigure 2.80 N-MOSFET vertical structures...Figure 2.81 Parasitic resistances within a MOSFET.Figure 2.82 Parasitic capacitances within a MOSFET.Figure 2.83 Equivalent circuit of a N-MOSFET.Figure 2.84 Switching characteristics of a N-MOSFET.Figure 2.85 IGBT Switching characteristic.Figure 2.86 IGBT structure.Figure 2.87 IGBT Punch through and non punch through Structures.Figure 2.88 Parasitic resistances with IGBT.Figure 2.89 Parasitic capacitances with IGBT.Figure 2.90 IGBT turn-on and turn-off transient waveforms.Figure 2.91 Summary of Si, SiC, and GaN material properties...Figure 2.92 Example of thermal impedance from 5SNG 0150Q170300 ABB module ...Figure 2.93 Multi-stack body.Figure (a) Multi-stack thermal structure.Figure (b) Equivalent thermalnetwork Source: Alavi et al. (2017).Figure 2.94 The Cauer thermal model of the IGBT...Figure 2.95 The Foster thermal model from junction to case...Figure 2.96 General constitution of a flat capacitor.Figure 2.97 Cylindrical geometry (a) and stack geometry (b) of real capacitors.Figure 2.98 Equivalent electrical diagram of a capacitor.Figure 2.99 Phase difference between 𝑖𝑐 and u of a real capacitor.Figure 2.100 World consumption by type of capacitor (2012).Figure 2.101 Variable air capacitor–different capacity values.Figure 2.102 Composition of a ceramic capacitor.Figure 2.103 Photos of polyester capacitors.Figure 2.104 Photo of a polycarbonate capacitor.Figure 2.105 Photo of a polypropylene capacitor.Figure 2.106 Photo of a polystyrene capacitor.Figure 2.107 Range of use of the different families of capacitors.Figure 2.108 Faults repartition for different power components (Abdennadher (2010)).Figure 2.109 Stress upon power module. Source: Mitsubishi (2019).Figure 2.110 Scanning Electron Microscopy with a Focused Ion Beam Gate cut of an...Figure 2.111 Cross-sectional view of a power module. Source: Zhang (2012).Figure 2.112 Packaging and chip failure mechanisms....Figure 2.113 Graph of the failure modes.Figure 2.114 Gate-related and collector-related TSEP parameters.Figure 2.115 Transient waveforms of IGBT module under inductive load...Figure 2.116 Comparisons of six Time-based TSEPs under different load currentsFigure 2.117 Collector current estimation using integration of...Figure 2.118 Waveforms of turn-on 𝑖𝑐 and related induced....Figure 2.119 Comparison of the different TSEP...Figure 2.120 Zth curves for different cycle steps...Figure 2.121 IGBT Saturation Voltage dependencies.Figure 2.122 V CEsatversus T jcalibration...Figure 2.123 Representation of voltage vectors and the 6 sectorsFigure 2.124 Representation of one voltage vector in case of defect.Figure 2.125 Experimental results with a misfiring during..Figure 2.126 Experimental results with a misfiring during...Figure 2.127 Inverter under an intermittent misfiring gate on Transistor T1.Figure 2.128 Representation of voltage vectors and the 4 sectors failed.Figure 2.129 Scheme of the inverter under an intermittent misfiring in the ledge...Figure 2.130 Scheme of the inverter under one component fault...Figure 2.131 Rds on versus number of cycles until...Figure 2.132 Three-level inverter diagnosis Flowchart...Figure 2.133 Three level inverter diagnosis system. Courtesy of IEEE.Figure 2.134 Multichip Terminal illustration. Chen et al. (2020a).Figure 2.135 Schematic of the on-state voltage measurement. Chen et al. (2020a).Figure 2.136 Thermal Model.Figure 2.137 Single-phase rectifier.Zisi Tian and Ge (2016) with permission of IEEE.Figure 2.138 FFT of currents.Zisi Tian and Ge (2016) with permission of IEEE.Figure 2.139 Input current frequency domain diagnosis method...Figure 2.140 Current vector...Figure 2.141 Gates signal: q 1, q 2and...Figure 2.142 Experimental results with a misfiring during...Figure 2.143 Experimental results with a misfiring during...Figure 2.144 Experimental results with a misfiring during....Figure 2.145 Diagnosis based on clustering Ondel et al...Figure 2.146 Membership function in exclusive and non-exclusive case...Figure 2.147 Full Bridge Rectifier (Mohagheghi et al. (2009))...Figure 2.148 Training of the Neural Network (Mohagheghi et al. (2009))...Figure 2.149 General Detection Process (Masrur et al. (2007)).Figure 2.150 Control Parameter Selection (Masrur et al. (2007)).Figure 2.151 Failure mechanism based prognosis process.Figure 2.152 Example of B10 lifetime curves of the solder joints of the conductorFigure 2.153 Temperature profile modeling.Figure 2.154 Rain flow counting.Figure 2.155 Prognosis process based on Failure Precursors.Figure 2.156 Prognosis uncertainty and performance.Figure 2.157 Illustration of an iterative prediction.Figure 2.158 Illustration of a set of direct, multi-horizon predictions...Figure 2.159 Illustration of a parallel prediction...Figure 2.160 Particle Filter Tracking and Prediction...Figure 2.161 Schematic of the proposed prognostic method. ...Figure 2.162 3-D representation of the 120 samples of the signature according ...Figure 2.163 Application of a Neural Network Classifier. Source: Hologne (2018).Figure 2.164 Structure of BP neural network. Source: Wu et al..Figure 2.165 Degradation profile of collector-emitter voltage for one IGBT...Figure 2.166 Comparing RUL prediction between ANFIS and Neural network ...Figure 2.167 Fuzzy prognosis method. (a) Flowchart diagram of fuzzy logic...Figure 2.168 Prognosis incertitude and performance...Figure 2.169 Schematic diagram of the recursive estimation by recursive least...Figure 2.170 Electrical diagram of a capacitor.Figure 2.171 Trending prediction of C by a one-step ahead prediction strategy...Figure 2.172 Trending prediction of ESR by a one-step ahead prediction strategy...Figure 2.173 NFN architecture for the prediction of the ESR and C.Figure 2.174 Membership value for an input according to triangular curves.
Читать дальшеИнтервал:
Закладка:
Похожие книги на «Fault Diagnosis, Prognosis, and Reliability for Electrical Machines and Drives»
Представляем Вашему вниманию похожие книги на «Fault Diagnosis, Prognosis, and Reliability for Electrical Machines and Drives» списком для выбора. Мы отобрали схожую по названию и смыслу литературу в надежде предоставить читателям больше вариантов отыскать новые, интересные, ещё непрочитанные произведения.
Обсуждение, отзывы о книге «Fault Diagnosis, Prognosis, and Reliability for Electrical Machines and Drives» и просто собственные мнения читателей. Оставьте ваши комментарии, напишите, что Вы думаете о произведении, его смысле или главных героях. Укажите что конкретно понравилось, а что нет, и почему Вы так считаете.


