Daniel Minoli - High-Density and De-Densified Smart Campus Communications
Здесь есть возможность читать онлайн «Daniel Minoli - High-Density and De-Densified Smart Campus Communications» — ознакомительный отрывок электронной книги совершенно бесплатно, а после прочтения отрывка купить полную версию. В некоторых случаях можно слушать аудио, скачать через торрент в формате fb2 и присутствует краткое содержание. Жанр: unrecognised, на английском языке. Описание произведения, (предисловие) а так же отзывы посетителей доступны на портале библиотеки ЛибКат.

- Название:High-Density and De-Densified Smart Campus Communications
- Автор:
- Жанр:
- Год:неизвестен
- ISBN:нет данных
- Рейтинг книги:3 / 5. Голосов: 1
-
Избранное:Добавить в избранное
- Отзывы:
-
Ваша оценка:
High-Density and De-Densified Smart Campus Communications: краткое содержание, описание и аннотация
Предлагаем к чтению аннотацию, описание, краткое содержание или предисловие (зависит от того, что написал сам автор книги «High-Density and De-Densified Smart Campus Communications»). Если вы не нашли необходимую информацию о книге — напишите в комментариях, мы постараемся отыскать её.
The book includes information about security requirements, large and boutique solution providers, applications, unbundled services, implementation planning and design, as well as operations and network management. An epilogue written by Josie Jo-Anne Dressendofer of Slice Wireless concludes the text. Readers will also benefit from the inclusion of:
A thorough introduction to background and functional requirements for high density communications, including requirements for airports, stadiums, convention centers, classrooms, train and subway stations, and smart cities An exploration of traditional voice and cellular technology, including DAS designs and architectures and microcellularization Practical discussions of traditional data and Wi-Fi, including throughput/interference and security A treatment of evolved hotspot connectivity, including Wi-Fi and 5G Perfect for telecommunication researchers and engineers, networking professionals, technology professionals, campus administrators, and equipment vendors,
will also earn a place in the libraries of senior undergraduate and graduate students in applied communications technologies.
High-Density and De-Densified Smart Campus Communications — читать онлайн ознакомительный отрывок
Ниже представлен текст книги, разбитый по страницам. Система сохранения места последней прочитанной страницы, позволяет с удобством читать онлайн бесплатно книгу «High-Density and De-Densified Smart Campus Communications», без необходимости каждый раз заново искать на чём Вы остановились. Поставьте закладку, и сможете в любой момент перейти на страницу, на которой закончили чтение.
Интервал:
Закладка:
One million connections per square kilometer (also definable as 1 connection per m 2) equates to one connection every 10 ft 2(1 km 2= 10 763 910 ft 2); this is considerably higher than the connectivity goals in an office environment, where typically one has an allocated space of 130–150 ft 2per worker, with one or two connections per worker; this is also higher than the connectivity in a classroom (say a 40 × 40 ft locale and 32 students, or one connection every 50 ft 2). Another example could be train cars with 200 users (perhaps not all simultaneously active) in 1000 ft 2, or one connection every 10 ft 2if only 50% of the passengers are active at any one point in time.
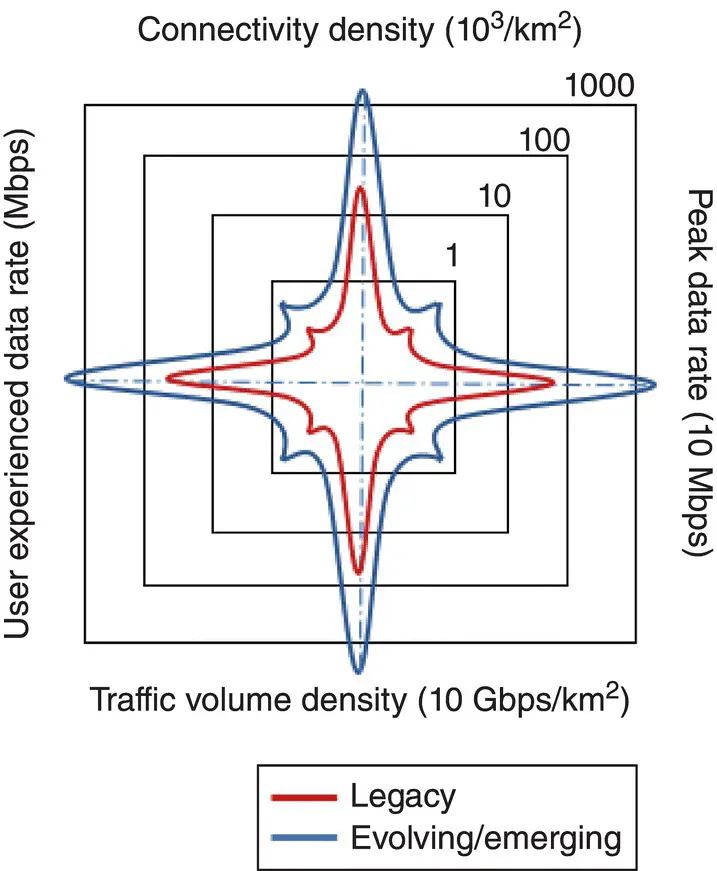
FIGURE 1.1 Requirements bouquet.
TABLE 1.1 Key Performance Indicators HDC Key Performance Indicators (KPIs)
| Key Performance Indicators | Description |
|---|---|
| Connection density | Total number of connected devices per unit area (n/km 2) |
| User experienced data rate | Minimum data rate for a user in the actual network environment (bps) |
| Peak data rate | Maximum achievable data rate per user (bps) |
| Traffic volume density | Total data rate of all users per unit area (bps/km 2) |
| End‐to‐end latency | Time lag between the transmission of a data packet from the source and the successful reception at the destination (ms) |
| Scalability | The ability to retain the above‐defined KPIs over large venues and/or geographic areas |
In addition to traditional communications, evolving requirements for high‐density environments include wearables (for example, in augmented reality applications), M2M, and vehicular traffic in Intelligent Transportation Systems (ITSs) environments. For example, densities of 1 node per m 2have been identified for augmented reality applications, as with Personal Area Network (PAN) mechanisms [10]. For ITSs, vehicle density has been one of the main metrics used for assessing road traffic conditions: a high vehicle density usually indicates that the road or street is congested [11]; the communication traffic is comprised of beacon signals and user‐generated signals. A congested road with stopped vehicular traffic might have, say, 12 cars in an area of 2500 ft 2, or a density of 1 car in about 200 ft 2– each car could have multiple user sessions. Beyond user counts, the requirements span data rates, as highlighted in Table 1.1; some M2M and process control applications have stringent reliability and latency requirements. Applications such as Ultra HD video Streaming Over The Top (OTT), augmented reality, and online gaming impose challenging requirements on bandwidth and latency; however, these applications are not expected, in the short term at least, to have major deployment in mobile environments, but more so in stationary domiciled environments.
Additional key factors to take into consideration when deploying a state‐of‐the‐art HDC system include spectrum utilization, energy consumption, and infrastructure and endpoint system cost [2]. Spectrum efficiency is measured as the data throughput per unit of spectrum resource per cell or per unit area (bps/Hz/cell or bps/Hz/km 2); energy efficiency is quantified in terms of the number of bits that can be transmitted per unit of energy (bits/J); infrastructure cost efficiency can be defined by the number of bits that can be transmitted per unit cost as computed from network infrastructure amortization/allocation (bits/$); endpoint system costs are clearly the endsystem costs, especially for the air interface and the protocol stack resources, to support a given maximum throughput; applicable to human devices (e.g. smartphones) and M2M systems. Improvements in these metrics of one‐to‐two orders of magnitude are being sought compared with legacy environments.
A number of use cases follow.
1.2.1 Pre‐pandemic/Long‐term Requirements for Airports
Table 1.2identifies some target design parameters for airport applications, including voice, video, data, IoT, IoT‐based security (video surveillance), IoT‐based automation, and wayfinding. Two characteristics of airports are as follow: (i) people at the airport are in a “slave” situation typically with nothing to do but to use their electronic devices – this is unlike a stadium or a school where other events and occurrences take up some of the person's time, thus likely diminishing the connection time of the individuals; (ii) multiple automation M2M‐like tasks may be at play in the airport including baggage handling, wayfinding/mobility/movement, and security. HDC requirements continue to be active, even, or especially, in emergency cases (these requirements were instituted in early 2020 and continued to be active as of press time [12]) – one example of a challenging airport environment even as the pandemic was already raging, is illustrated in Figure 1.2. Typically, the visitor's public airport communication support is completely separate and walled‐off from the high‐security airport operations networks – the discussion and network design considered in this book focus on the former and not the latter, although similar technologies may be at play. Another characteristic is that, unlike stadiums, there is a nearly continuous requirement for connectivity, especially in large hub airports; stadiums are only used for relatively short periods a few times a week (once, less than once, or a few times a week). In addition to visitors, there are stationary concession businesses in the airport that would often make use of the same network infrastructure as the public network, although some administratively secure slice (for example, separate Virtual LANs [VLANs] would be used).
TABLE 1.2 HDC KPIs for Airports
| Key Performance Indicators | Key Performance Indicators | Pre‐pandemic Requirements |
|---|---|---|
| Data/VoIP connection density, for people on smartphones, laptops, tablets | Data/VoIP connection density, for people on smartphones, laptops, tablets | 1 per 20 ft 2in terminals |
| User experienced data rate | 10–50 Mbps | |
| Peak data rate | 100 Mbps | |
| Traffic volume density | 5 Gbps per gate area (200 people per gate) | |
| End‐to‐end latency | 100 ms | |
| Wayfinding | Throughout airport and in adjacent spaces, garages, car rental locations | |
| Area of coverage | Entire airport and in adjacent spaces, garages, car rental locations | |
| Traditional telephony on DAS systems | Dialtone | 50 Erlangs per gate area (200 people per gate) |
| Call length | 10 minutes per call | |
| Connection density, IoT devices | Connection density, IoT devices | 1 per 10 ft 2throughout airport |
| User experienced data rate | 0.384 Mbps | |
| Peak data rate | 0.768 Mbps | |
| Traffic volume density | 100 Mbps per 1000 ft 2throughout airport and in adjacent spaces, garages, car rental locations | |
| End‐to‐end latency | 1–10 ms | |
| Area of coverage | Entire airport and in adjacent spaces, garages, car rental locations |
According to the National Plan of Integrated Airport Systems (NPIAS), there are approximately 19 700 airports in the United States. 5170 of these airports are open to the general public and 503 of them serve commercial flights. A typical gate area is 30 000 ft 2(which would equate to an area of 40 × 75 ft); however, not all of that space is usable for sojourn (implying that some areas within the 30 000 ft 2area may have a higher concentration of semi‐stationary users). If the busy hour concentration of people is 150 people, then there will be 1 person per 200 ft 2(a 10 × 20 feet area); however, there may be overcrowding situations where the concentration is comparable to the design goals depicted in Table 1.2. See Table 1.3for the top 30 airports in the United States. Internationally, the Beijing Capital International Airport (Chaoyang‐Shunyi, Beijing, China) is the second largest in the world, following the Hartsfield–Jackson Atlanta International Airport, with about 50 million passengers per year as of 2018; Tokyo Haneda Airport (Ōta, Tokyo, Japan) had 41 million passengers; Dubai International Airport (Garhoud, Dubai, United Arab Emirates) had 42 million passengers; and London Heathrow Airport (Hillingdon, London, United Kingdom) had 39 million passengers.
Читать дальшеИнтервал:
Закладка:
Похожие книги на «High-Density and De-Densified Smart Campus Communications»
Представляем Вашему вниманию похожие книги на «High-Density and De-Densified Smart Campus Communications» списком для выбора. Мы отобрали схожую по названию и смыслу литературу в надежде предоставить читателям больше вариантов отыскать новые, интересные, ещё непрочитанные произведения.


Обсуждение, отзывы о книге «High-Density and De-Densified Smart Campus Communications» и просто собственные мнения читателей. Оставьте ваши комментарии, напишите, что Вы думаете о произведении, его смысле или главных героях. Укажите что конкретно понравилось, а что нет, и почему Вы так считаете.