Kalyan K. Sen - Power Flow Control Solutions for a Modern Grid Using SMART Power Flow Controllers
Здесь есть возможность читать онлайн «Kalyan K. Sen - Power Flow Control Solutions for a Modern Grid Using SMART Power Flow Controllers» — ознакомительный отрывок электронной книги совершенно бесплатно, а после прочтения отрывка купить полную версию. В некоторых случаях можно слушать аудио, скачать через торрент в формате fb2 и присутствует краткое содержание. Жанр: unrecognised, на английском языке. Описание произведения, (предисловие) а так же отзывы посетителей доступны на портале библиотеки ЛибКат.
- Название:Power Flow Control Solutions for a Modern Grid Using SMART Power Flow Controllers
- Автор:
- Жанр:
- Год:неизвестен
- ISBN:нет данных
- Рейтинг книги:5 / 5. Голосов: 1
-
Избранное:Добавить в избранное
- Отзывы:
-
Ваша оценка:
Power Flow Control Solutions for a Modern Grid Using SMART Power Flow Controllers: краткое содержание, описание и аннотация
Предлагаем к чтению аннотацию, описание, краткое содержание или предисловие (зависит от того, что написал сам автор книги «Power Flow Control Solutions for a Modern Grid Using SMART Power Flow Controllers»). Если вы не нашли необходимую информацию о книге — напишите в комментариях, мы постараемся отыскать её.
Power Flow Control Solutions for a Modern Grid using SMART Power Flow Controllers
Power Flow Control Solutions for a Modern Grid using SMART Power Flow Controllers
Power Flow Control Solutions for a Modern Grid Using SMART Power Flow Controllers — читать онлайн ознакомительный отрывок
Ниже представлен текст книги, разбитый по страницам. Система сохранения места последней прочитанной страницы, позволяет с удобством читать онлайн бесплатно книгу «Power Flow Control Solutions for a Modern Grid Using SMART Power Flow Controllers», без необходимости каждый раз заново искать на чём Вы остановились. Поставьте закладку, и сможете в любой момент перейти на страницу, на которой закончили чтение.
Интервал:
Закладка:
The final report on the blackout stated that more high‐voltage lines must be built and perhaps even more important, the power grid must be made SMARTER. A self‐healing SMART grid is needed to be able to recognize the problem and then reconfigure the power grid. If IRs were strategically located, these overloaded lines would have their power flows controlled to be within their ATC limits and would neither trip the line nor contribute to the blackout. Hence, the IR improves grid reliability and resiliency.
1.2 Traditional Power Flow Control Concepts
The flow of AC power, irrespective of its source, has two components: active power and reactive power. A transmission line consists of electrical conductors that may be composed of many sections. Each section consists of a resistance ( R′ ), inductive reactance ( X′ L), and line‐to‐ground (shunt) capacitive reactance ( X′ C) as shown in Figure 1-3. Since there is no significant storage of electric power at the utility scale, the active power, except for the loss in the resistance of the conductor, reaches from one end of the line to the other end. This active power can be used for lighting, heating, cooling, motion force in electric motors, and so on. The distributed series inductive and shunt capacitive reactances of the line absorb and generate reactive power, respectively. This reactive power flow causes an extra loss in the resistance of the line.
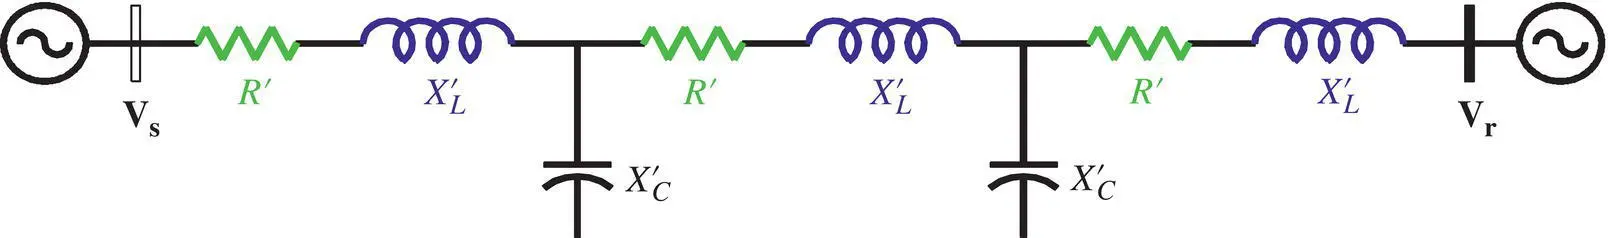
Figure 1-3 Representation of a transmission line between sending and receiving ends.
The symbols shown in the figure are
Vs is the sending‐end voltage with a magnitude (Vs) and a phase angle (δs),
Vr is the receiving‐end voltage with a magnitude (Vr) and a phase angle (δr),
R′ is the line resistance in each section,
X′L is the inductive reactance in each section of the line, and
X′C is the line‐to‐ground (shunt) capacitive reactance in each section.
Transmission lines with lengths less than 50 miles (80.5 km) are classified as being short lines; lines of lengths between 50 and 150 miles (80.5 and 241.4 km) are classified as medium‐length lines and lines above 150 miles (241.4 km) are considered long lines. Consider a line in the interconnected transmission system, connecting sources and loads as shown in Figure 1-1as a relatively short line where the capacitive shunt reactance from the line to ground and among the lines can be ignored as shown in Figure 1-4. The resistances and inductive reactances from all the line sections are lumped together as shown in the figure. The natural power flow in an AC transmission line depends on (1) magnitudes of the sending and receiving‐end voltages, (2) phase angle between these voltages, and (3) line impedance.
The additional symbols shown in the figure are
VXn is the natural voltage across the line reactance with a magnitude (VXn) and a phase angle (θVXn),
VRn is the natural voltage across the line resistance with a magnitude (VRn) and a phase angle (θVRn),
In is the natural line current with a magnitude (In) and a phase angle (θIn),
Psn is the natural active power flow at the sending end,
Qsn is the natural reactive power flow at the sending end, Figure 1-4 Power flow along a transmission line between sending and receiving ends.
Prn is the natural active power flow at the receiving end,
Qrn is the natural reactive power flow at the receiving end,
R is the line resistance (R > 0 and represents a positive resistance), and
X is the line reactance (X > 0 and represents an inductive reactance).
The natural active and reactive power flows ( P snand Q sn) at the sending end are derived in Appendix Bas
(B‐12) 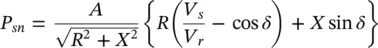
and
(B‐14) 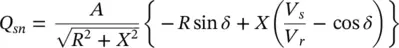
where
(B‐13) 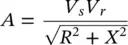
and the power angle is given in Chapter 2as
(2‐27) 
The natural active and reactive power flows ( P rnand Q rn) at the receiving end are
(B‐21) 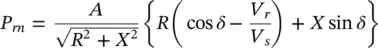
and
(B‐22) 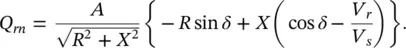
Ignoring the line resistance as shown in Figure 1-5a, the natural active and reactive power flows ( P snand Q sn) at the sending end and the natural active and reactive power flows ( P rnand Q rn) at the receiving end for a relatively short lossless line are
(2‐40) 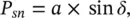
(2‐43) 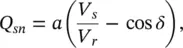
(2‐46) 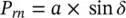
and
(2‐48) 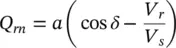
where
(2‐41) 
In addition to using these formulae to characterize a two‐generator/single‐line power system network, they may be used when designing an electrical generator where the V sand V rare the generator’s internal voltage and terminal voltage, respectively, and X is the internal reactance of the generator as shown in Figure 1-5b. When designing an inverter, V srepresents the inverter’s output voltage, which is typically created using a Pulse‐Width Modulation (PWM) technique and passed through a filter that consists of an inductor with a reactance ( X ) and a capacitor ( C f) to create a filtered voltage, V r, as shown in Figure 1-5c.
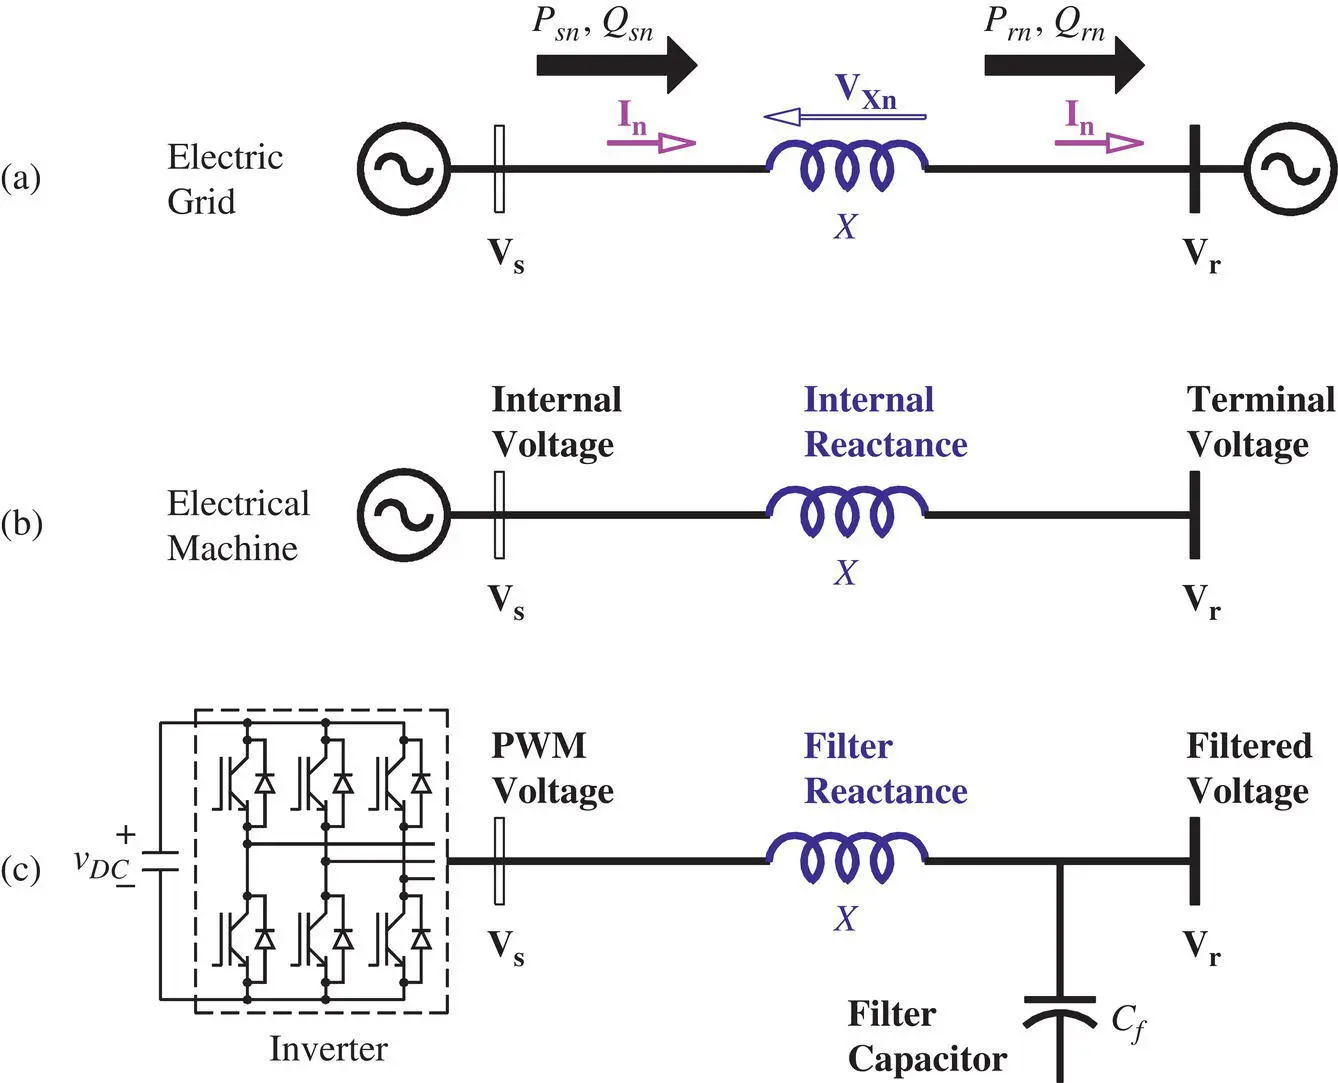
Figure 1-5 (a) Electric grid: power flow along a lossless transmission line between sending and receiving ends; (b) equivalent representation of an electrical machine; (c) equivalent representation of an inverter.
Читать дальшеИнтервал:
Закладка:
Похожие книги на «Power Flow Control Solutions for a Modern Grid Using SMART Power Flow Controllers»
Представляем Вашему вниманию похожие книги на «Power Flow Control Solutions for a Modern Grid Using SMART Power Flow Controllers» списком для выбора. Мы отобрали схожую по названию и смыслу литературу в надежде предоставить читателям больше вариантов отыскать новые, интересные, ещё непрочитанные произведения.


Обсуждение, отзывы о книге «Power Flow Control Solutions for a Modern Grid Using SMART Power Flow Controllers» и просто собственные мнения читателей. Оставьте ваши комментарии, напишите, что Вы думаете о произведении, его смысле или главных героях. Укажите что конкретно понравилось, а что нет, и почему Вы так считаете.