Lawrence S. Maisel - AI-Enabled Analytics for Business
Здесь есть возможность читать онлайн «Lawrence S. Maisel - AI-Enabled Analytics for Business» — ознакомительный отрывок электронной книги совершенно бесплатно, а после прочтения отрывка купить полную версию. В некоторых случаях можно слушать аудио, скачать через торрент в формате fb2 и присутствует краткое содержание. Жанр: unrecognised, на английском языке. Описание произведения, (предисловие) а так же отзывы посетителей доступны на портале библиотеки ЛибКат.
- Название:AI-Enabled Analytics for Business
- Автор:
- Жанр:
- Год:неизвестен
- ISBN:нет данных
- Рейтинг книги:3 / 5. Голосов: 1
-
Избранное:Добавить в избранное
- Отзывы:
-
Ваша оценка:
AI-Enabled Analytics for Business: краткое содержание, описание и аннотация
Предлагаем к чтению аннотацию, описание, краткое содержание или предисловие (зависит от того, что написал сам автор книги «AI-Enabled Analytics for Business»). Если вы не нашли необходимую информацию о книге — напишите в комментариях, мы постараемся отыскать её.
is your Roadmap to meet this essential business capability. To ensure we can plan for the future vs react to the future when it arrives, we need to develop and deploy a toolbox of tools, techniques, and effective processes to reveal forward-looking unbiased insights that help us understand significant patterns, relationships, and trends. This book promotes clarity to enable you to make better decisions from insights about the future.
Learn how advanced analytics ensures that your people have the right information at the right time to gain critical insights and performance opportunities Empower better, smarter decision making by implementing AI-enabled analytics decision support tools Uncover patterns and insights in data, and discover facts about your business that will unlock greater performance Gain inspiration from practical examples and use cases showing how to move your business toward AI-Enabled decision making
is a must-have practical resource for directors, officers, and executives across various functional disciplines who seek increased business performance and valuation.
AI-Enabled Analytics for Business — читать онлайн ознакомительный отрывок
Ниже представлен текст книги, разбитый по страницам. Система сохранения места последней прочитанной страницы, позволяет с удобством читать онлайн бесплатно книгу «AI-Enabled Analytics for Business», без необходимости каждый раз заново искать на чём Вы остановились. Поставьте закладку, и сможете в любой момент перейти на страницу, на которой закончили чтение.
Интервал:
Закладка:
Large ML projects often involve the collaboration of data scientists, programmers, database administrators, and application developers (to render a deliverable outcome). Further, ML needs large volumes of high-quality data to “train” the ML model, and it is this data requirement that causes 8 of 10 ML and AI projects to stall. 4 While ML is popular and powerful, it is not easy. Many new software applications are making ML use easier, but it is still mostly for data scientists.
Before an ML project can begin, its “object” must be defined: that is, what is to be solved. For example, suppose we want to predict which customers on our ecommerce website will proceed to check out (vs. those who exit before checking out). As presented in Figure 1.2, the process to go from the object to deployed solution has many steps, including collection of data, preparation of data, selecting the algorithm and its programming, model training, model testing, and deployment. Any failure at any point will require a reset and/or restart back to any previous point in the process. 3
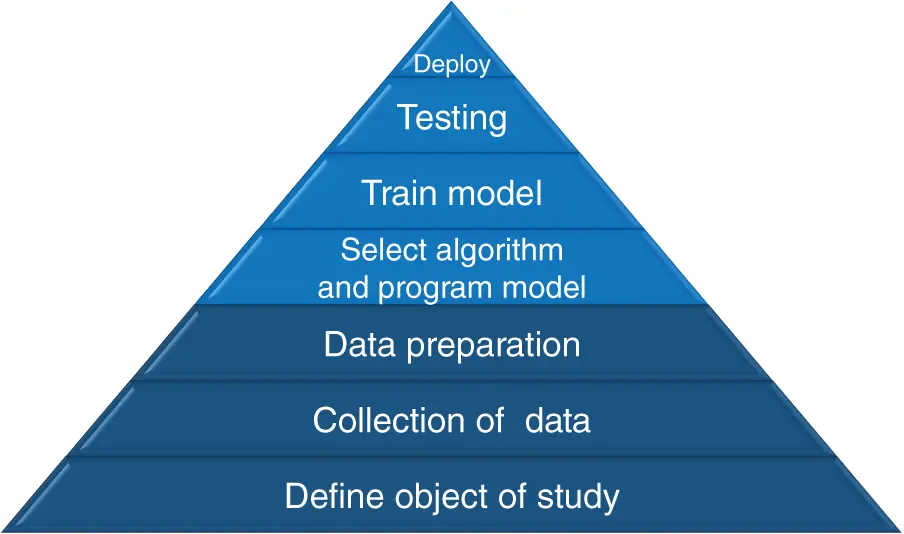
Figure 1.2 ML process.
ML has a limitation in that the solution of the object is highly specific to the data used to train the ML model. Most often, the model is not transportable, even to a similar business or a similar department within the same business. Also, as mentioned, the use of ML often requires other tools to render its results useful for consumption by business managers. However, while complex, ML can offer high business value with a wide range of applications: for example, predicting customer churn, sales deals that will close in the next 60 days, drugs that are likely to proceed to the next phase in trials, customers who are more likely to buy with a 5% discount, demand forecasting, and so on.
ANALYTICS VS. ANALYSIS
Another set of terms to get our arms around is analysis and analytics . Analysis, in business reporting, involves calculations of arithmetic (add, subtract, multiply, and divide), whereas analytics for business encompasses mathematics (algebra, trigonometry, geometry, calculus, etc.) and statistics (about the study of outcomes).
In a profit and loss statement, there is a variance analysis of current year actual performance against budget. The analysis is expressed as the difference in dollars and as a percent. The variance analysis uses arithmetic to make a measurement of the existing condition of the company compared to what it planned for the year. This analysis is comparative information from arithmetic on data and descriptive of a current situation, but it is not an insight that is additive to a decision.
Insight, as defined with respect to the value from data, is that not known about the business and when known should affect decisions , and insights are derived from analytics that applies mathematics to data.
For example, say sales are down 15% for the past three months, but sales are predicted to increase this month. This prediction is based on a correlation of unemployment as a three-month inverse leading indicator to sales, meaning as unemployment goes down, sales will go up. In this example, unemployment has been dropping for the past three months, so the prediction is for sales to increase in the current month.
The use of correlations to make a prediction is analytics that reveals an insight, which was not known from the data or information from the analysis of the data, and which when known will affect decisions. In this case, without knowing the prediction of the lead indicator, the business would run deep discounts to attract sales. However, knowing that sales are predicted to reverse direction would cause the business not to discount or to only offer small discounts.
As such, to crystalize and distinguish the important definitions of insights and information , we repeat that insights are derived from the application of mathematics on data, while information is derived from the application of arithmetic on data. Information is used to support a decision, whereas insights are used to affect a decision.
Accordingly, analytics can powerfully reveal unbiased insights, as it applies mathematics on data that is void of the personal and political pressures that are exerted on humans when they make forecasts and predictions. As humans, we want the future to be what we desire or what we need, so we can make any forecast come to our desired outcome. As such, analytics is especially potent to enable unbiased data-driven decisions.
BI AND DATA VISUALIZATION VS. ANALYTICS
Business intelligence (BI) tools date back to the 1980s and enabled multidimensional reporting. BI went beyond spreadsheets to ingest large amounts of data from several data sources and then segment (into separate dimensions) the data into hierarchies. This approach gave users the ability to organize and dive into more data more intelligently.
Today, legacy BI tools have essentially become data-marts for data extraction into spreadsheets for reporting. BI tools are largely maintained by IT and require programming to build cubes (specialized BI databases) to respond to predefined questions. However, legacy BI is too rigid and complex for most users, so IT departments often program user-requested reports and data extractions (for download to other applications).
The complexity of BI gave birth to data visualization tools that were introduced in the 2000s and offered graphic representations of data in many forms, often combined into dashboards to render a story about key aspects of the business. Dashboards can be informative but typically not analytical.
The reference to data visualization says it all in its name. It is visualizing data, not applying mathematics on data. An excerpt from a 2019 report from the Finance Analytics Institute ( www.fainstitute.com), “Visualization vs. Analytics, what each tool is, how they are different & where they apply,” offers a clear discussion of visualization: 4
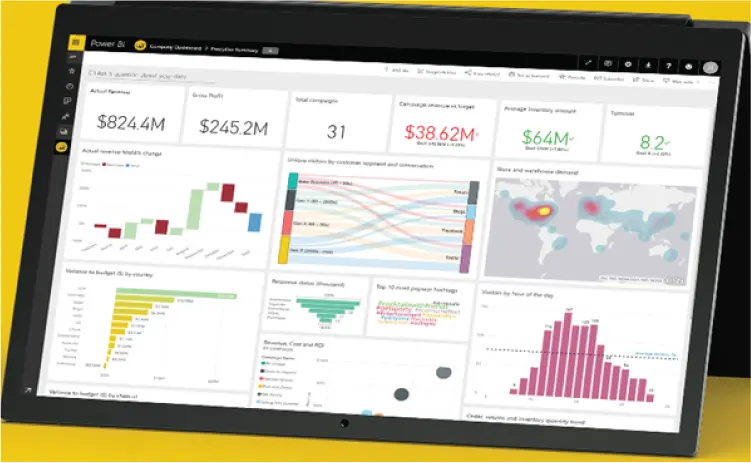
Dashboards are of prime value to combine visual charts with tabular data of KPIs and key values for comparisons.
The picture below is … where data and images of trends can work together to offer a view to the past and present. Like a car's dashboard, the numerical readings at the top tell key performance data needed to be known; e.g. if we're running low on gas…
But dashboards are not predictive, and views of past data can lead to false negatives or positives of the future. Look at the image below [Figure A]…
The historical trend is essentially up. So, what's the next bar to follow? Up? Down? What decision would you make if you predicted up? What would happen if you guessed wrong? As seen on the chart below [Figure B], the next bar was substantially down.
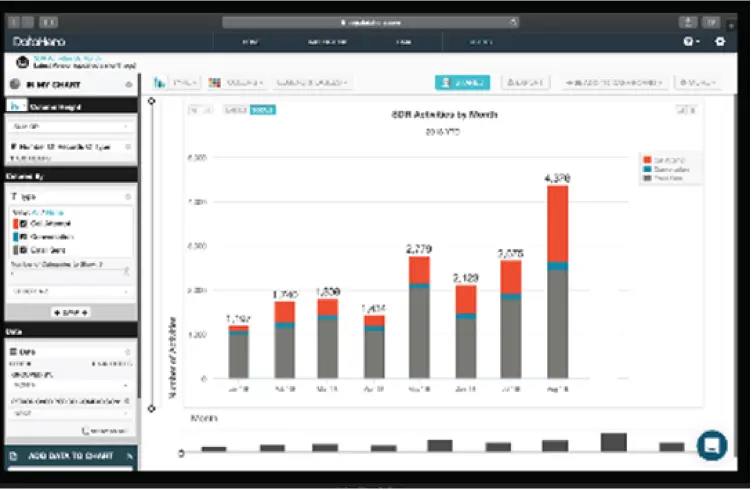
Figure A
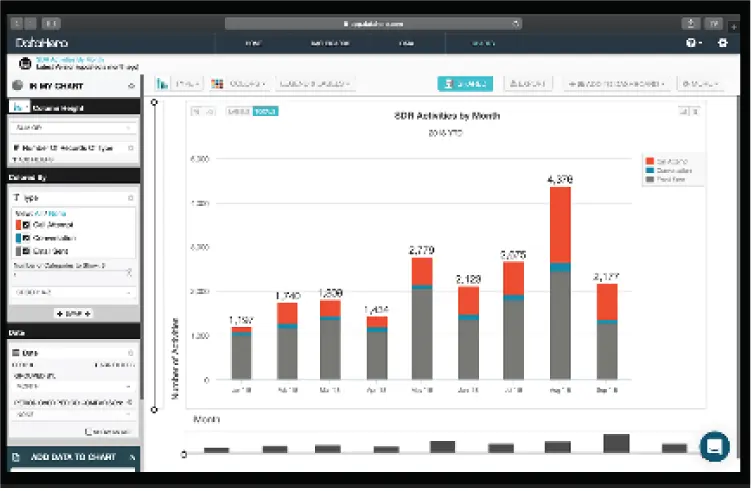
Figure B
Visualization gives colors and images that intrigue the eye. But there is pretty and there is practical, and the two should not be confused—although they often are. Far too frequently, dashboards become an exercise in art vs. business. The rendering of a dashboard should be to make better decisions; so when viewing a dashboard, always ask, “Will what I'm seeing help inform me to make a better decision? What decision?” If the answer is not definitive, then the dashboard is art, not business.
Читать дальшеИнтервал:
Закладка:
Похожие книги на «AI-Enabled Analytics for Business»
Представляем Вашему вниманию похожие книги на «AI-Enabled Analytics for Business» списком для выбора. Мы отобрали схожую по названию и смыслу литературу в надежде предоставить читателям больше вариантов отыскать новые, интересные, ещё непрочитанные произведения.


Обсуждение, отзывы о книге «AI-Enabled Analytics for Business» и просто собственные мнения читателей. Оставьте ваши комментарии, напишите, что Вы думаете о произведении, его смысле или главных героях. Укажите что конкретно понравилось, а что нет, и почему Вы так считаете.