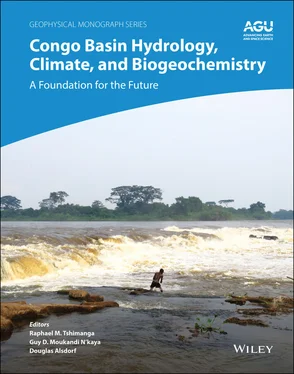
Congo Basin Hydrology, Climate, and Biogeochemistry
Здесь есть возможность читать онлайн «Congo Basin Hydrology, Climate, and Biogeochemistry» — ознакомительный отрывок электронной книги совершенно бесплатно, а после прочтения отрывка купить полную версию. В некоторых случаях можно слушать аудио, скачать через торрент в формате fb2 и присутствует краткое содержание. Жанр: unrecognised, на английском языке. Описание произведения, (предисловие) а так же отзывы посетителей доступны на портале библиотеки ЛибКат.
- Название:Congo Basin Hydrology, Climate, and Biogeochemistry
- Автор:
- Жанр:
- Год:неизвестен
- ISBN:нет данных
- Рейтинг книги:3 / 5. Голосов: 1
-
Избранное:Добавить в избранное
- Отзывы:
-
Ваша оценка:
- 60
- 1
- 2
- 3
- 4
- 5
Congo Basin Hydrology, Climate, and Biogeochemistry: краткое содержание, описание и аннотация
Предлагаем к чтению аннотацию, описание, краткое содержание или предисловие (зависит от того, что написал сам автор книги «Congo Basin Hydrology, Climate, and Biogeochemistry»). Если вы не нашли необходимую информацию о книге — напишите в комментариях, мы постараемся отыскать её.
Congo Basin Hydrology, Climate, and Biogeochemistry: A Foundation for the Future
Congo Basin Hydrology, Climate, and Biogeochemistry — читать онлайн ознакомительный отрывок
Ниже представлен текст книги, разбитый по страницам. Система сохранения места последней прочитанной страницы, позволяет с удобством читать онлайн бесплатно книгу «Congo Basin Hydrology, Climate, and Biogeochemistry», без необходимости каждый раз заново искать на чём Вы остановились. Поставьте закладку, и сможете в любой момент перейти на страницу, на которой закончили чтение.
Интервал:
Закладка:
5 Chapter 5 Figure 5.1 Spatiotemporal SPEI patterns of the Congo basin using 12‐month gr... Figure 5.2 Estimated areas affected by various drought intensities (extreme,... Figure 5.3 Spatial distribution of trends in GRACE‐derived TWS (2002–2017) o... Figure 5.4 Aerial averaged temporal series of TWS (2002–2017) estimated from... Figure 5.5 Leading modes of TWS (2002–2017) over the Congo basin. Averaged s... Figure 5.6 Assessing climate influence on surface water hydrology over the C... Figure 5.7 Modeling the temporal dynamics of Congo River discharge (1980–201... Figure 5.8 Surface water storage over the Congo Basin during the extreme dro...
6 Chapter 6 Figure 6.1 Topographic map of the Ubangi basin at Mobaye, and of the hydropl... Figure 6.2 Vegetation map of the Ubangi basin at Mobaye, the geological bedr... Figure 6.3 Rainfall index and flow index of the Ubangi basin at Mobaye, 1938... Figure 6.4 Rainfall index of upstream basins of the Ubangi at Mobaye, from 1... Figure 6.5 Hydrologic index from 1948 to 1995 for the hydrological basins of... Figure 6.6 Comparative interannual evolution of the runoff (LE) of the Ubang... Figure 6.7 Interannual evolution of river depletion coefficient from the Uba... Figure 6.8 Relationship of water runoff as a function of the precipitated wa... Figure 6.9 Decennial evolution of runoff coefficients (CE) from the Ubangi a... Figure 6.10 Relationship between the runoff coefficient (CE) and the rate of...
7 Chapter 7 Figure 7.1 Study domain with the five agroecological zones in Cameroon. The ... Figure 7.2 (a) Study domain (Cameroon) with the Congo Basin (solid red line)... Figure 7.3 Mean monthly accumulated (mm) rainfall for different stations. St... Figure 7.4 Mean annual correlation for the mentioned stations. Figure 7.5 Mean annual biases (mm/year) over the available data period for d... Figure 7.6 Mean monthly tropical rain belt position over Cameroon for the pe... Figure 7.7 Daily time series of accumulated rainfall over Maroua, Garoua, an... Figure 7.8 Daily time series of accumulated rainfall over Bertoua, Douala, a... Figure 7.9 Categorical indices for daily rainfall and linear regression fitt... Figure 7.10 Sensitivity of categorical indices (a: BIAS [frequency bias], b:... Figure 7.11 Interannual Hovmöller diagrams of the monthly accumulated convec...Figure 7.12 Spatiotemporal distribution of the 90th percentile of the monthl...Figure 7.13 Same as Figure 7.12, but for 3B43.Figure 7.14 Correlation, mean absolute error (MAE), root mean square error (...
8 Chapter 8Figure 8.1 Congo Basin: a) situation of the Congo Basin and the five main hy...Figure 8.2 Congo Basin and its main drainage subsystems. The sub‐basins stud...Figure 8.3 Topography of the Congo Basin and the flooded portion of the Cent...Figure 8.4 Sequencing of the reduced centered variables: (a) rainfall for th...Figure 8.5 Changes in mean daily hydrological regimes by homogeneous flow pe...Figure 8.6 Comparison of hydrological regimes of the seven main drainage ent...
9 Chapter 9Figure 9.1 Study region showing the Congo Basin. The Congo River and its num...Figure 9.2 Relationship between GPCC and CRU‐based precipitation over the Co...Figure 9.3 Spatial distribution of GPCC‐based precipitation (mm) over the Co...Figure 9.4 Analysis of (a) trends (mm/yr) and harmonic components (mean annu...Figure 9.5 Spatial and temporal variability in the Congo Basin rainfall (mm)...Figure 9.6 Spatial and temporal variability in the Congo basin rainfall (mm)...Figure 9.7 Spatial distribution of trends (mm/yr) in (a) annual and (b) maxi...Figure 9.8 Dominant modes of river discharge time series of the Congo river ...Figure 9.9 Interannual variations and cumulative departures of rainfall and ...Figure 9.10 Temporal relationship between rainfall and discharge during 1903...Figure 9.11 Localized rainfall (mm) over the Congo Basin (1991–2010). The in...
10 Chapter 10Figure 10.1 Geographical location of the Congo River Basin showing river net...Figure 10.2 The spatial distribution of monthly (a) precipitation and (b) te...Figure 10.3 The land‐use and land cover distribution in the Congo River Basi...Figure 10.4 Change in land cover in the Congo River Basin between 1992–2003 ...Figure 10.5 Change in land cover in the Qubangui and Middle Congo regions be...Figure 10.6 Spatial variation in daily precipitation for historical (1950–20...Figure 10.7 Spatial variation in the daily temperature for historical (1950–...Figure 10.8 Results of land cover change analyses. (a) Spatial maps of ET de...Figure 10.9 Spatial maps of terrestrial water storage change (TWSC) from GRA...Figure 10.10 Variation in the ensemble mean of monthly total water storage c...Figure 10.11 Comparisons of total water storage anomalies (TWSAs) and MPDSI....Figure 10.12 Historical drought conditions in the Congo Basin. (a) Time seri...Figure 10.13 Historical drought conditions in the Congo Basin. (a, b) Time s...Figure 10.14 Water budget changes between historical (1956–2005) and future ...
11 Chapter 11Figure 11.1 Geographic location of the CRB and the Land cover in 2003 with a...Figure 11.2 Geographical location of the CRB (green) and regions selected as...Figure 11.3 Temporal evolution of the SPI (a) and SPEI (b) at time scales of...Figure 11.4 Trends of (a) SPEI‐1 and (b) SPEI‐12 from 1981–2018. Significant...Figure 11.5 Contribution (%) of climatological moisture to precipitation ove...Figure 11.6 Temporal correlations between monthly anomalies of │( E – P ) < 0│...Figure 11.7 Monthly anomalies of the contributions of moisture from the AO (...Figure 11.8 Scatterplot: anomalies in moisture contributed from the (a) AO, ...Figure 11.9 Temporal evolution of the │( E – P ) < 0│ anomalies computed over ...Figure 11.10 Trends of │( E – P ) < 0│ calculated over the CRB for air masses ...
12 Chapter 12Figure 12.1 Congo Basin features.Figure 12.2 Distribution and hydrologic properties of the dominant soils in ...Figure 12.3 Conceptual dominant hydrologic processes for the CRB.Figure 12.4 Density of streamflow gauges in the CRB before the 1960s (left) ...Figure 12.5 Development of a WEAP application in the CRB (the water demand s...Figure 12.6 Magnitude of predictive uncertainty in model simulation at the r...Figure 12.7 Magnitude of predictive uncertainty in model simulation for high...Figure 12.8 Observed and simulated monthly flows from GW‐Pitman and WEAP at ...Figure 12.9 Observed and simulated monthly flows from GW‐Pitman for selected...Figure 12.10 Observed and simulated monthly flows from GW‐Pitman for selecte...Figure 12.11 Observed and simulated monthly flows from GW‐Pitman for selecte...Figure 12.12 Observed and simulated monthly flows from GW‐Pitman and WEAP at...Figure 12.13 Observed and simulated monthly flows from GW‐Pitman for selecte...Figure 12.14 Observed and simulated monthly flows from GW‐Pitman at K‐CB85 g...Figure 12.15 Observed and simulated monthly flows from GW‐Pitman for selecte...Figure 12.16 Observed and simulated monthly flows from GW‐Pitman for selecte...Figure 12.17 Spatial distributions of lakes and wetlands in the Lualaba drai...Figure 12.18 Observed and simulated flow volume from GW‐Pitman at L‐CB68 (ID...Figure 12.19 Observed and simulated flow volume from GW‐Pitman at L‐CB74 (ID...Figure 12.20 Observed and simulated streamflow volume using the wetland sub‐...Figure 12.21 Observed and simulated flow volume for the lower Lualaba gaugin...Figure 12.22 Observed and simulated flow volume from WEAP for the Kinshasa s...
13 Chapter 13Figure 13.1 Map of study area with eight wetlands along the Congo mainstem. ...Figure 13.2 Flux rates over each wetland. The shaded areas represent the unc...
14 Chapter 14Figure 14.1 Shuttle radar topography mission (SRTM) digital elevation model ...Figure 14.2 (a) Outline map of the Congo River basin showing the four main d...Figure 14.3 Main SWAT inputs showing (a) land uses, (b) soil classes, (c) di...Figure 14.4 Close up map of the Cuvette Centrale in the CRB wetlands showing...Figure 14.5 Envisat stage measurements compared with simulated and observed ...Figure 14.6 Maps of mean annual rainfall, interception, evapotranspiration, ...Figure 14.7 Hydrograph showing the observed and simulated discharge for the ...Figure 14.8 Pie chart showing the annual mean contribution of Cuvette Centra...Figure 14.9 Average monthly interannual hydrograph of flows in and out, prec...Figure 14.10 Relative interannual change in storage within the Cuvette Centr...Figure 14.11 Monthly averages of water balance components (in millimeters) w...
Читать дальшеИнтервал:
Закладка:
Похожие книги на «Congo Basin Hydrology, Climate, and Biogeochemistry»
Представляем Вашему вниманию похожие книги на «Congo Basin Hydrology, Climate, and Biogeochemistry» списком для выбора. Мы отобрали схожую по названию и смыслу литературу в надежде предоставить читателям больше вариантов отыскать новые, интересные, ещё непрочитанные произведения.
Обсуждение, отзывы о книге «Congo Basin Hydrology, Climate, and Biogeochemistry» и просто собственные мнения читателей. Оставьте ваши комментарии, напишите, что Вы думаете о произведении, его смысле или главных героях. Укажите что конкретно понравилось, а что нет, и почему Вы так считаете.


