The Internet of Medical Things (IoMT)
Здесь есть возможность читать онлайн «The Internet of Medical Things (IoMT)» — ознакомительный отрывок электронной книги совершенно бесплатно, а после прочтения отрывка купить полную версию. В некоторых случаях можно слушать аудио, скачать через торрент в формате fb2 и присутствует краткое содержание. Жанр: unrecognised, на английском языке. Описание произведения, (предисловие) а так же отзывы посетителей доступны на портале библиотеки ЛибКат.
- Название:The Internet of Medical Things (IoMT)
- Автор:
- Жанр:
- Год:неизвестен
- ISBN:нет данных
- Рейтинг книги:3 / 5. Голосов: 1
-
Избранное:Добавить в избранное
- Отзывы:
-
Ваша оценка:
The Internet of Medical Things (IoMT): краткое содержание, описание и аннотация
Предлагаем к чтению аннотацию, описание, краткое содержание или предисловие (зависит от того, что написал сам автор книги «The Internet of Medical Things (IoMT)»). Если вы не нашли необходимую информацию о книге — напишите в комментариях, мы постараемся отыскать её.
Providing an essential addition to the reference material available in the field of IoMT, this timely publication covers a range of applied research on healthcare, biomedical data mining, and the security and privacy of health records.
The Internet of Medical Things (IoMT) — читать онлайн ознакомительный отрывок
Ниже представлен текст книги, разбитый по страницам. Система сохранения места последней прочитанной страницы, позволяет с удобством читать онлайн бесплатно книгу «The Internet of Medical Things (IoMT)», без необходимости каждый раз заново искать на чём Вы остановились. Поставьте закладку, и сможете в любой момент перейти на страницу, на которой закончили чтение.
Интервал:
Закладка:
The greater number of arginine in the protein model enhances the stability of the protein. This is happens through the electrostatic interactions between their guanidine group [29]. Hence, it was confirmed that all the protein models are in the identical stable conditions. The outcome of Cys_ Recserver exhibits that the quantity of disulfide bonds in EGFR is 42, K-ras oncogene protein is 5, and TP53 is 11 (Table 1.2).
1.3.2 Prediction of Secondary Structures
Results from SOPMA analysis shows that random coils dominant among secondary structure components in the protein models ( Figure 1.1). The constitution of alpha helix in EGFR, K-ras oncogene protein, and TP53 were shown in Table 1.3.
The outcome from this analysis specified that EGFR, K-ras oncogene protein, and TP53 constitutes of 15, 11, and 10α helices, respectively. Besides that, Table 1.4 represents the details of the longest and shortest alpha helix of all the protein models.
1.3.3 Verification of Stability of Protein Structures
PROCHECK server was used to verify the stereo chemical quality and the geometry of protein models through Ramachandran plots ( Figure 1.2). Furthermore, it was revealed that all the protein structures are in most favorable region because they had percentage value more than 80% (Table 1.5). Thus, the standard of these proteins was assessed to be immense and reliable. On top of that, PROCHECK analysis disclose that a number of residues such as TYR265 and GLU51 for EGFR while LYS180 for K-ras oncogene protein were located away from energetically favored regions of Ramachandran plot. Besides that, there are no residues found at forbade region for TP53 protein model.
Thereby, the stereo chemical interpretation of backbone phi/psi dihedral angles deduced that EGFR, K-ras oncogene protein, and TP53 have low percentage of residues among the protein models. Moreover, ProQ was utilized in order to validate “the quality” with the usage of Levitt-Gerstein (LG) score and maximum subarray (MaxSub). All the protein models were within the range for LG and MaxSub score according to the outcome exhibited for creating a good model (Table 1.5).
Table 1.2The number disulfide bonds were quantitated by Cys_Rec prediction program.
| Protein | Cys_Rec | Score |
| EGFR | Cys_9 | –13.0 |
| Cys_13 | 39.2 | |
| Cys_17 | 100.1 | |
| Cys_25 | 98.3 | |
| Cys_26 | 104.2 | |
| Cys_30 | 104.1 | |
| Cys_34 | 90.5 | |
| Cys_42 | 48.2 | |
| Cys_45 | 56.0 | |
| Cys_54 | 58.2 | |
| Cys_58 | 49.5 | |
| Cys_85 | 55.7 | |
| Cys_89 | 54.9 | |
| Cys_101 | 50.4 | |
| Cys_105 | 44.0 | |
| Cys_120 | 63.0 | |
| Cys_123 | 73.3 | |
| Cys_127 | 75.3 | |
| Cys_131 | 61.6 | |
| Cys_156 | 33.0 | |
| Cys_264 | 45.3 | |
| Cys_293 | 43.8 | |
| Cys_300 | 56.5 | |
| Cys_304 | 46.8 | |
| Cys_309 | 66.0 | |
| Cys_317 | 65.6 | |
| Cys_320 | 60.2 | |
| Cys_329 | 49.1 | |
| Cys_333 | 42.2 | |
| Cys_349 | 42.2 | |
| Cys_352 | 32.9 | |
| Cys_356 | 62.9 | |
| Cys_365 | 70.2 | |
| Cys_373 | 54.2 | |
| Cys_376 | 54.8 | |
| Cys_385 | 35.8 | |
| Cys_389 | 41.2 | |
| Cys_411 | 78.8 | |
| Cys_414 | 85.1 | |
| Cys_418 | 84.4 | |
| Cys_422 | 26.5 | |
| Cys_430 | 3.7 | |
| KRAS | Cys_12 | –28.5 |
| Cys_51 | –74.2 | |
| Cys_80 | –72.6 | |
| Cys_118 | –56.4 | |
| Cys_185 | –15.2 | |
| TP53 | Cys_124 | –19.4 |
| Cys_135 | –1.6 | |
| Cys_141 | –17.9 | |
| Cys_176 | –9.1 | |
| Cys_182 | –45.1 | |
| Cys_229 | –54.4 | |
| Cys_238 | 1.6 | |
| Cys_242 | –5.5 | |
| Cys_275 | –34.4 | |
| Cys_277 | –51.5 | |
| Cys_339 | –32.8 |
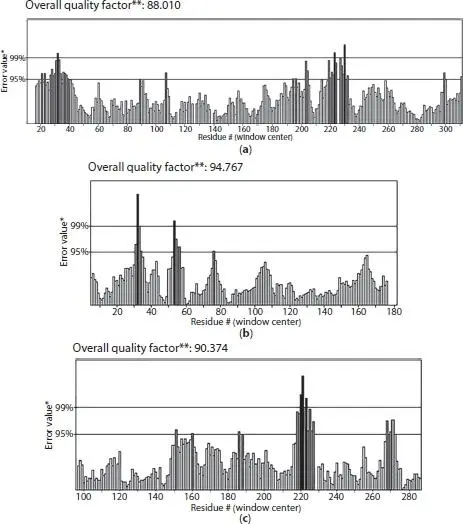
ERRAT analysis is used for assessing the protein models which were determined by x-ray crystallography. Next, the value of ERRAT relies upon the statistics of non-bonded atomic interactions in the 3D protein structures. The protein is generally accepted as high quality protein if the percentage is greater than 50%. The ERRAT analysis score result shows that K-ras oncogene protein had the highest at 94.767. Therefore, it can be seen that K-ras oncogene protein has high quality resolution among the protein models. Besides that, the score value for EGFR is 88.010 while 90.374 for TP53 ( Figure 1.3).
The Verify3D server was used to reveal the residues in each protein in which EGFR, K-ras oncogene, and TP53 had 98.59%, 100.00%, and 92.96% residues, respectively. Next, the average 3D-1D score of all three proteins are more than 0.2. As a consequence, it specifies that all of the sequences were in line with its protein model ( Figure 1.4). Certainly, the resulting energy minimized EGFR, K-ras oncogene protein, and TP53 protein models satisfied the standard for evaluation of protein. Hence, the docking analysis with ligand will be carried out.
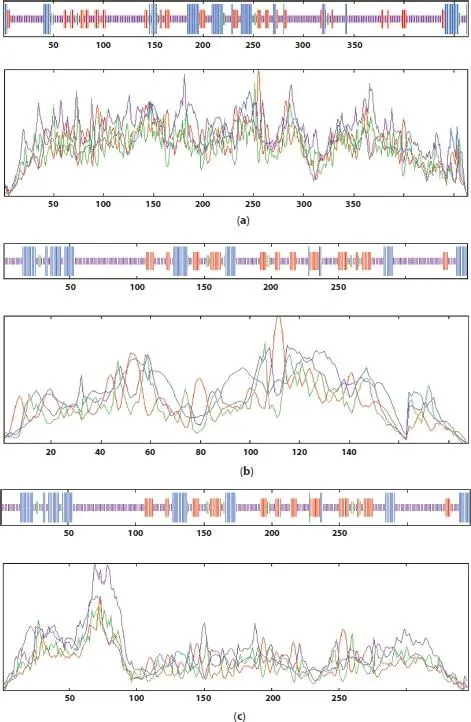
Figure 1.1 SOPMA plots for (a) EGFR, (b) K-ras oncogene protein, and (c) TP53.
Table 1.3Secondary structure of the EGFR, K-ras oncogene protein, and TP53.
| Secondary structure | Alpha helix (Hh) | Extended strand (Ee) | Beta turn (Tt) | Random coil (CC) |
| EGFR | 16.81 | 16.81 | 3.23 | 64.44 |
| KRAS | 43.62 | 21.81 | 7.45 | 27.13 |
| TP53 | 18.79 | 18.21 | 3.18 | 59.83 |
Table 1.4Composition of α-helix EGFR, K-ras oncogene protein, and TP53.
| Amino acid | Longest alpha helix | Residues | Shortest alpha helix | Number of residues |
| EGFR | α 14 | 14 | α 3, α 6, α 11, α 15 | 1 |
| KRAS | α 11 | 20 | α 1, α 10 | 1 |
| TP53 | α 5 | 11 | α 7 | 1 |
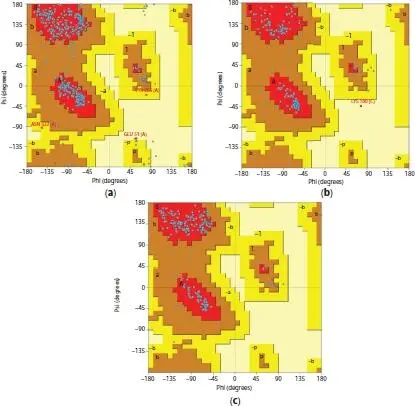
Figure 1.2 Ramachandran plots for (a) EGFR, (b) K-ras oncogene protein, and (c) TP53.
Table 1.5Validation of the EGFR, K-ras oncogene protein, and TP53.
| Structure | Ramachandran plot statistics | Goodness factor | ProQ | ||||||
| Most favored | Additionally allowed | Generously allowed | Disallowed | Dihedral angles | Covalent forces | Overall average | LG score | MaxSub | |
| EGFR | 90.6 | 8.6 | 0.6 | 0.3 | –0.27 | 0.02 | –0.14 | 3.814 | 0.302 |
| KRAS | 90.5 | 8.9 | 0.0 | 0.6 | –0.12 | 0.04 | –0.04 | 4.094 | 0.474 |
| TP53 | 92.9 | 7.1 | 0.0 | 0.0 | –0.16 | 0.07 | –0.06 | 4.417 | 0.454 |
Интервал:
Закладка:
Похожие книги на «The Internet of Medical Things (IoMT)»
Представляем Вашему вниманию похожие книги на «The Internet of Medical Things (IoMT)» списком для выбора. Мы отобрали схожую по названию и смыслу литературу в надежде предоставить читателям больше вариантов отыскать новые, интересные, ещё непрочитанные произведения.


Обсуждение, отзывы о книге «The Internet of Medical Things (IoMT)» и просто собственные мнения читателей. Оставьте ваши комментарии, напишите, что Вы думаете о произведении, его смысле или главных героях. Укажите что конкретно понравилось, а что нет, и почему Вы так считаете.