Handbook of Intelligent Computing and Optimization for Sustainable Development
Здесь есть возможность читать онлайн «Handbook of Intelligent Computing and Optimization for Sustainable Development» — ознакомительный отрывок электронной книги совершенно бесплатно, а после прочтения отрывка купить полную версию. В некоторых случаях можно слушать аудио, скачать через торрент в формате fb2 и присутствует краткое содержание. Жанр: unrecognised, на английском языке. Описание произведения, (предисловие) а так же отзывы посетителей доступны на портале библиотеки ЛибКат.

- Название:Handbook of Intelligent Computing and Optimization for Sustainable Development
- Автор:
- Жанр:
- Год:неизвестен
- ISBN:нет данных
- Рейтинг книги:5 / 5. Голосов: 1
-
Избранное:Добавить в избранное
- Отзывы:
-
Ваша оценка:
Handbook of Intelligent Computing and Optimization for Sustainable Development: краткое содержание, описание и аннотация
Предлагаем к чтению аннотацию, описание, краткое содержание или предисловие (зависит от того, что написал сам автор книги «Handbook of Intelligent Computing and Optimization for Sustainable Development»). Если вы не нашли необходимую информацию о книге — напишите в комментариях, мы постараемся отыскать её.
This book provides a comprehensive overview of the latest breakthroughs and recent progress in sustainable intelligent computing technologies, applications, and optimization techniques across various industries.
Audience Handbook of Intelligent Computing and Optimization for Sustainable Development
Handbook of Intelligent Computing and Optimization for Sustainable Development — читать онлайн ознакомительный отрывок
Ниже представлен текст книги, разбитый по страницам. Система сохранения места последней прочитанной страницы, позволяет с удобством читать онлайн бесплатно книгу «Handbook of Intelligent Computing and Optimization for Sustainable Development», без необходимости каждый раз заново искать на чём Вы остановились. Поставьте закладку, и сможете в любой момент перейти на страницу, на которой закончили чтение.
Интервал:
Закладка:
where TP , TN , FP , and FN denote the true positive, true negative, false positive, and false negative observations, respectively.
The garments of interest were verified manually with estimations (as the actual ground truth for the degree to which an active garment is a garment of interest to the customers was not available due to the subjective nature of the task). Visual illustrations of the results obtained in different scenarios have been displayed in Figures 3.5to 3.7. In these figures, a green box indicates a garment of interest , while a red box indicates an active garment which is not a garment of interest .
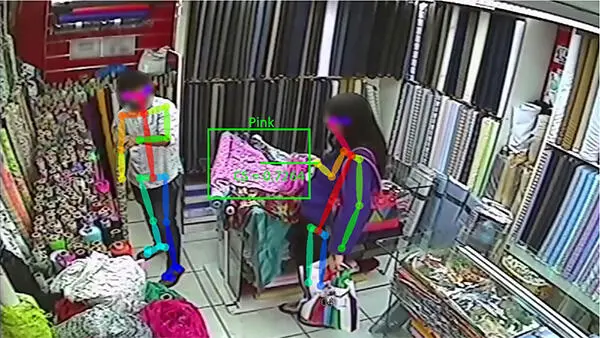
Figure 3.5 Identification of garment of interest in the presence of a single customer and a single active garment .
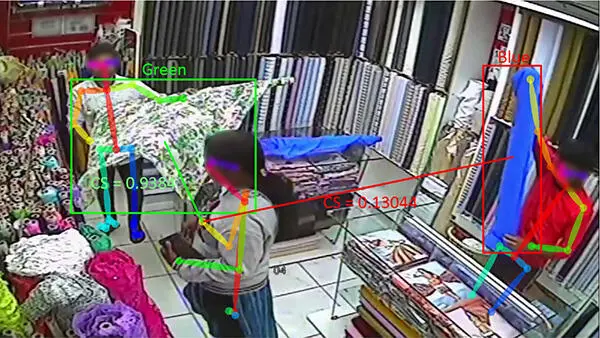
Figure 3.6Identification of garments of interest in the presence of a single customer and multiple active garments .
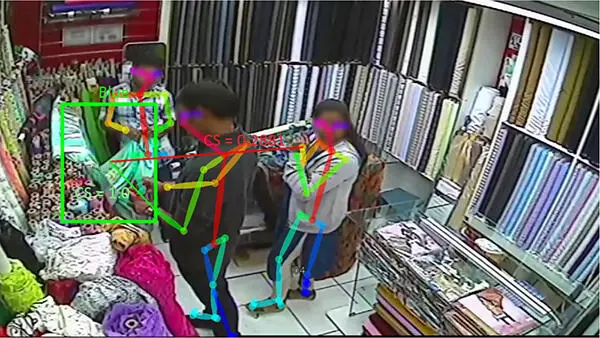
Figure 3.7 Identification of garments of interest in the presence of multiple customers.
The variation in the average confidence scores taken at varying confidence thresholds (δ) for a garment of interest of a given color is illustrated in Figure 3.8. From this figure, it can be observed that the variation takes the form of an S-curve, which signifies that the average confidence score mimics a logistic curve. Using this knowledge, we can easily observe that the confidence threshold (δ) of 0.6 is an optimal value (i.e., when the curve starts to flatten immediately after the point of inflection) to classify whether an active garment is a garment of interest to a given customer. The average confidence score at this confidence threshold (δ) exceeds 0.8 for all the colors under observation. This ensures that the wrists of the interacting person are sufficiently close to the active garment .
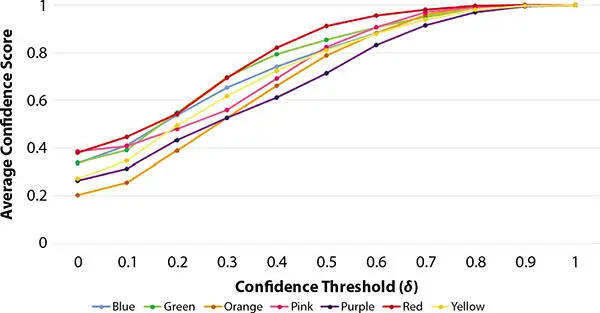
Figure 3.8 Variation of average confidence score with respect to changes in confidence threshold for garments of interest of a given color.
The average confidence score obtained by garments of interest for each given color at a confidence threshold (δ) of 0.6 is illustrated in Figure 3.9. This figure indicates the average degree to which the customers found the garment of a given color interesting, thereby providing insights into the colors customers found the most and least interesting for the garments present in the store.
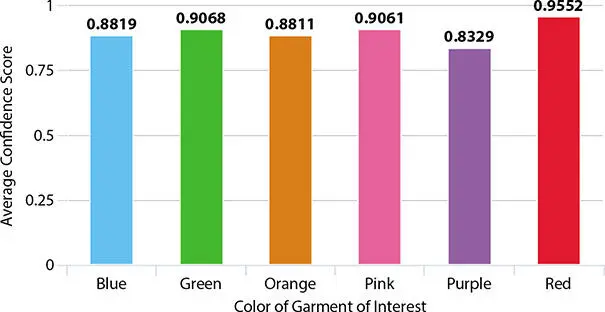
Figure 3.9 Average confidence score obtained by garments of interest of particular color at a confidence threshold of 0.60.
The distribution of the total duration of time for which the customers were interested in a garment of a given color at a confidence threshold (δ) of 0.6 is illustrated in Figure 3.10. This figure elucidates the distribution of the total time spent by the customers for each given color, thereby providing invaluable information about which color for a garment was most and least interacted with the customer base at the store.
3.4.3 Analysis of the Proposed Approach
It can be observed that the effectiveness of the proposed approach in detecting active garments depends on the foreground information extracted and the color masks applied subsequently. If the foreground information obtained after Stage 1 (refer to Figure 3.1) fails to capture an active garment , then the recall of the active garment detection is affected. Garments with consistent color and simple patterns were more accurately detected by the proposed approach as compared to garments with multiple colors and complex patterns. Active garments were partially detected in scenarios where the customer obstructed a major portion of the garment. The proposed approach was able to identify garments of interest well, especially when the garments and wrists of a customer are in clear view.
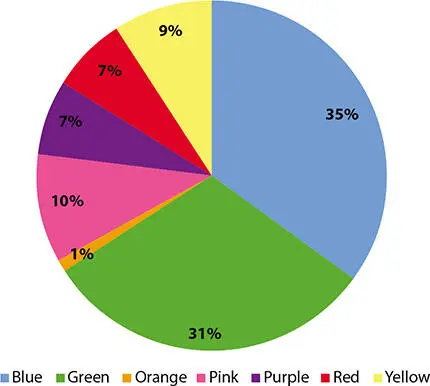
Figure 3.10 Total duration of time for which customers were interested in a garment of a given color at a confidence threshold of 0.60.
From the data displayed in Figures 3.9and 3.10, we can make the following key observations:
1 1. Customers spent the most time interacting with various garments having shades of blue or green color, which they found to be the most interesting compared to other colors.
2 2. Shades of red-colored garments showed the highest average confidence score consistently for all values of confidence thresholds thereby indicating that there was maximum interaction with a red-colored garment whenever one was detected as an active garment.
3 3. Customers found garments having shades of orange color the least interesting and spent the least amount of time on such garments. This indicates that they had minimum interaction with such garments which is reflected by the garments’ lowest average confidence scores as well.
The main advantage of the proposed approach is that it is able to indicate which customer is interested in which garment from a surveillance video. However, its disadvantage is that it finds it difficult to identify garments of interest correctly in highly crowded scenarios either due to the partial or complete obstruction of the garments or due to the difficulty in detecting the wrists of a person if they are obstructed by a garment.
3.5 Highlights
In this section, we highlight the major findings of this study. We utilize the GMG background subtraction algorithm for extracting the foreground information capturing non-stationary garments from the video of a surveillance camera. Using this foreground information, we are able to detect the garment regions which are then clustered to obtain the entire garment. We leverage the Mask R-CNN framework to detect customers from its object detection performed for the “person” class. Subsequently, we obtain the wrist feature points of these customers using OpenPose human pose estimation framework. Using these pieces of information, we propose a quantitative metric, known as the confidence score, which indicates the degree to which a customer is interested in a given garment. We take the Euclidean distance between the centroid of a garment and the coordinates of the wrist feature points of a customer and use the area of the garment to calculate the confidence score for the given pair of customer and garment. We analyze the variation of the average confidence score of garments of interest with a confidence threshold to generate meaningful evaluations.
3.6 Conclusion and Future Works
Интервал:
Закладка:
Похожие книги на «Handbook of Intelligent Computing and Optimization for Sustainable Development»
Представляем Вашему вниманию похожие книги на «Handbook of Intelligent Computing and Optimization for Sustainable Development» списком для выбора. Мы отобрали схожую по названию и смыслу литературу в надежде предоставить читателям больше вариантов отыскать новые, интересные, ещё непрочитанные произведения.


Обсуждение, отзывы о книге «Handbook of Intelligent Computing and Optimization for Sustainable Development» и просто собственные мнения читателей. Оставьте ваши комментарии, напишите, что Вы думаете о произведении, его смысле или главных героях. Укажите что конкретно понравилось, а что нет, и почему Вы так считаете.