Emergency Medicine Simulation Workbook
Здесь есть возможность читать онлайн «Emergency Medicine Simulation Workbook» — ознакомительный отрывок электронной книги совершенно бесплатно, а после прочтения отрывка купить полную версию. В некоторых случаях можно слушать аудио, скачать через торрент в формате fb2 и присутствует краткое содержание. Жанр: unrecognised, на английском языке. Описание произведения, (предисловие) а так же отзывы посетителей доступны на портале библиотеки ЛибКат.
- Название:Emergency Medicine Simulation Workbook
- Автор:
- Жанр:
- Год:неизвестен
- ISBN:нет данных
- Рейтинг книги:3 / 5. Голосов: 1
-
Избранное:Добавить в избранное
- Отзывы:
-
Ваша оценка:
Emergency Medicine Simulation Workbook: краткое содержание, описание и аннотация
Предлагаем к чтению аннотацию, описание, краткое содержание или предисловие (зависит от того, что написал сам автор книги «Emergency Medicine Simulation Workbook»). Если вы не нашли необходимую информацию о книге — напишите в комментариях, мы постараемся отыскать её.
Emergency Medicine Simulation Workbook
Emergency Medicine Simulation Workbook — читать онлайн ознакомительный отрывок
Ниже представлен текст книги, разбитый по страницам. Система сохранения места последней прочитанной страницы, позволяет с удобством читать онлайн бесплатно книгу «Emergency Medicine Simulation Workbook», без необходимости каждый раз заново искать на чём Вы остановились. Поставьте закладку, и сможете в любой момент перейти на страницу, на которой закончили чтение.
Интервал:
Закладка:
SELECTED READING FOR SIGMOID VOLVULUS
1 Vestal, H.S., Sowden, G., Nejad, S. et al. (2017). Simulation‐based training for residents in the management of acute agitation: a cluster randomized controlled trial. Acad. Psychiatry 41 (1): 62–67.
APPENDIX
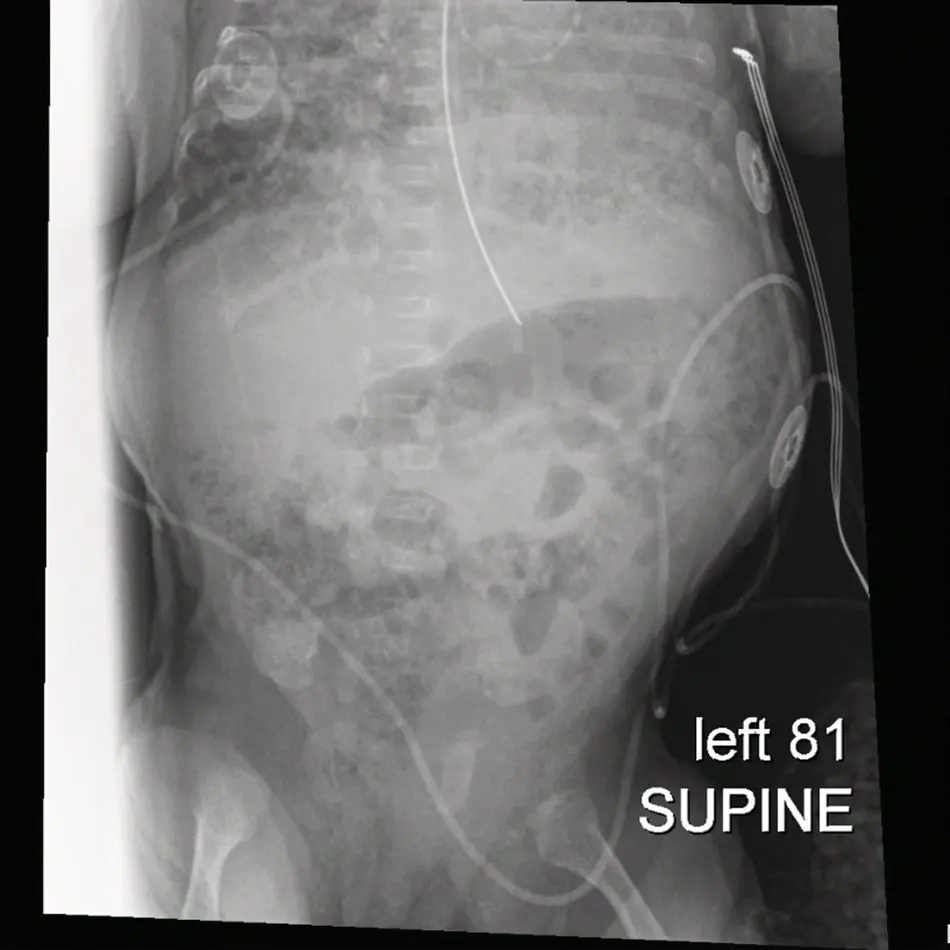
FIGURE 1.1 Abdominal x‐ray showing distended bowel with early intraluminal gas.
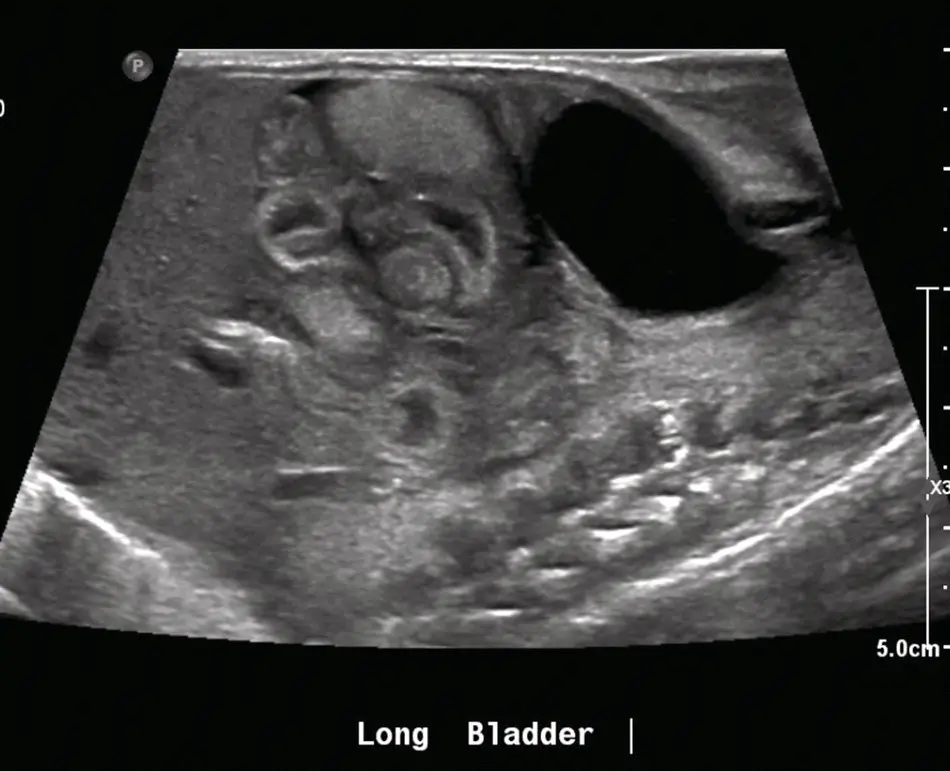
FIGURE 1.2 Abdominal ultrasound showing pneumatosis.
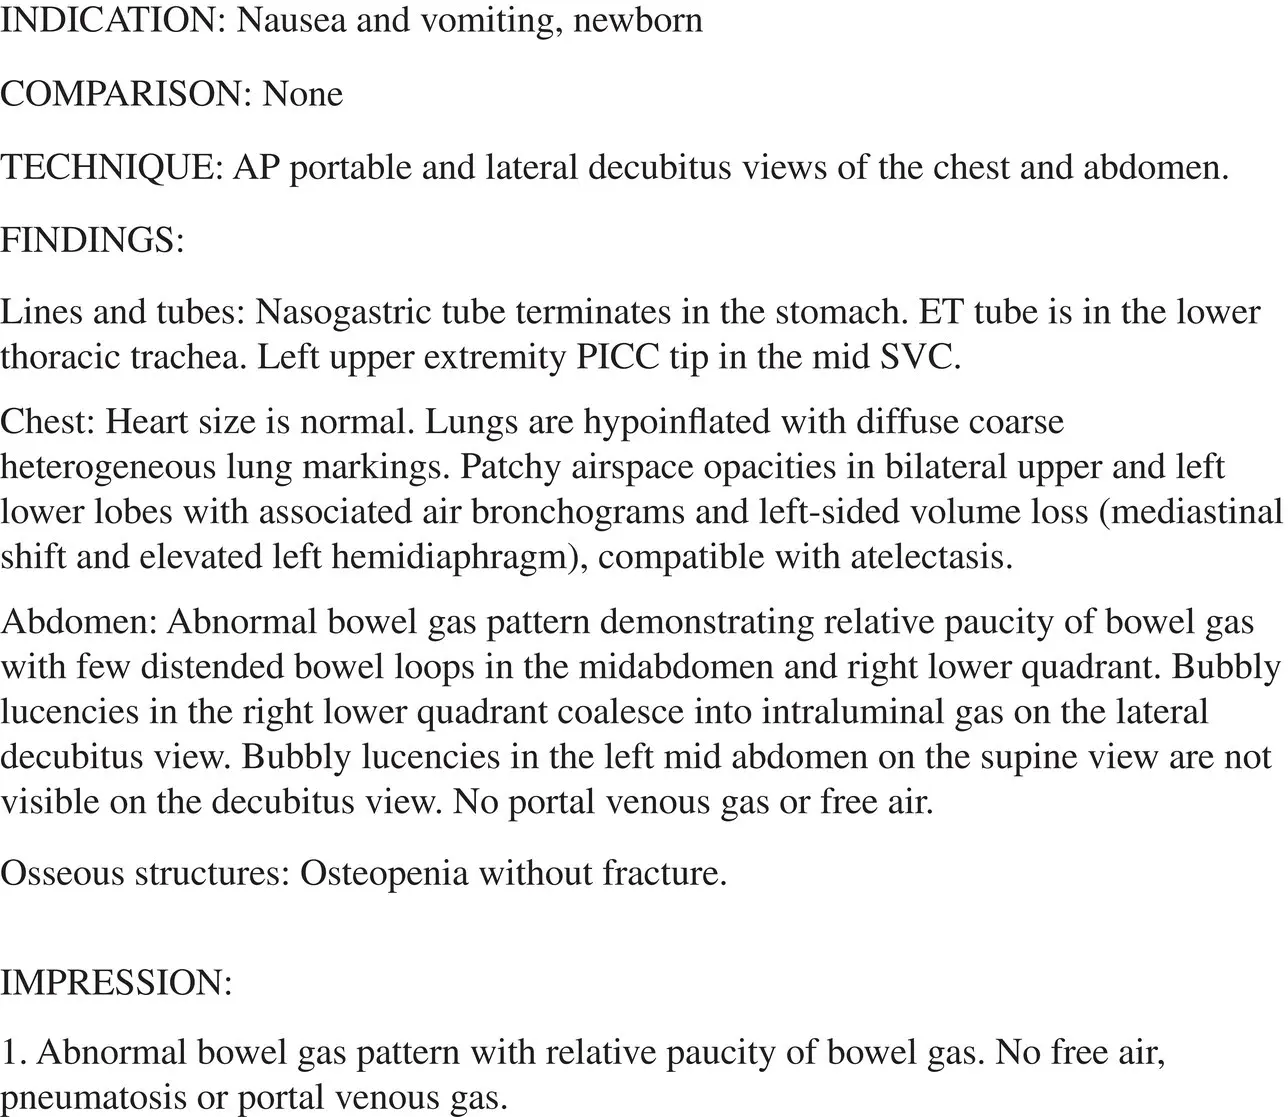
FIGURE 1.3 Radiological interpretation of abdominal x‐ray of concern for necrotizing enterocolitis.
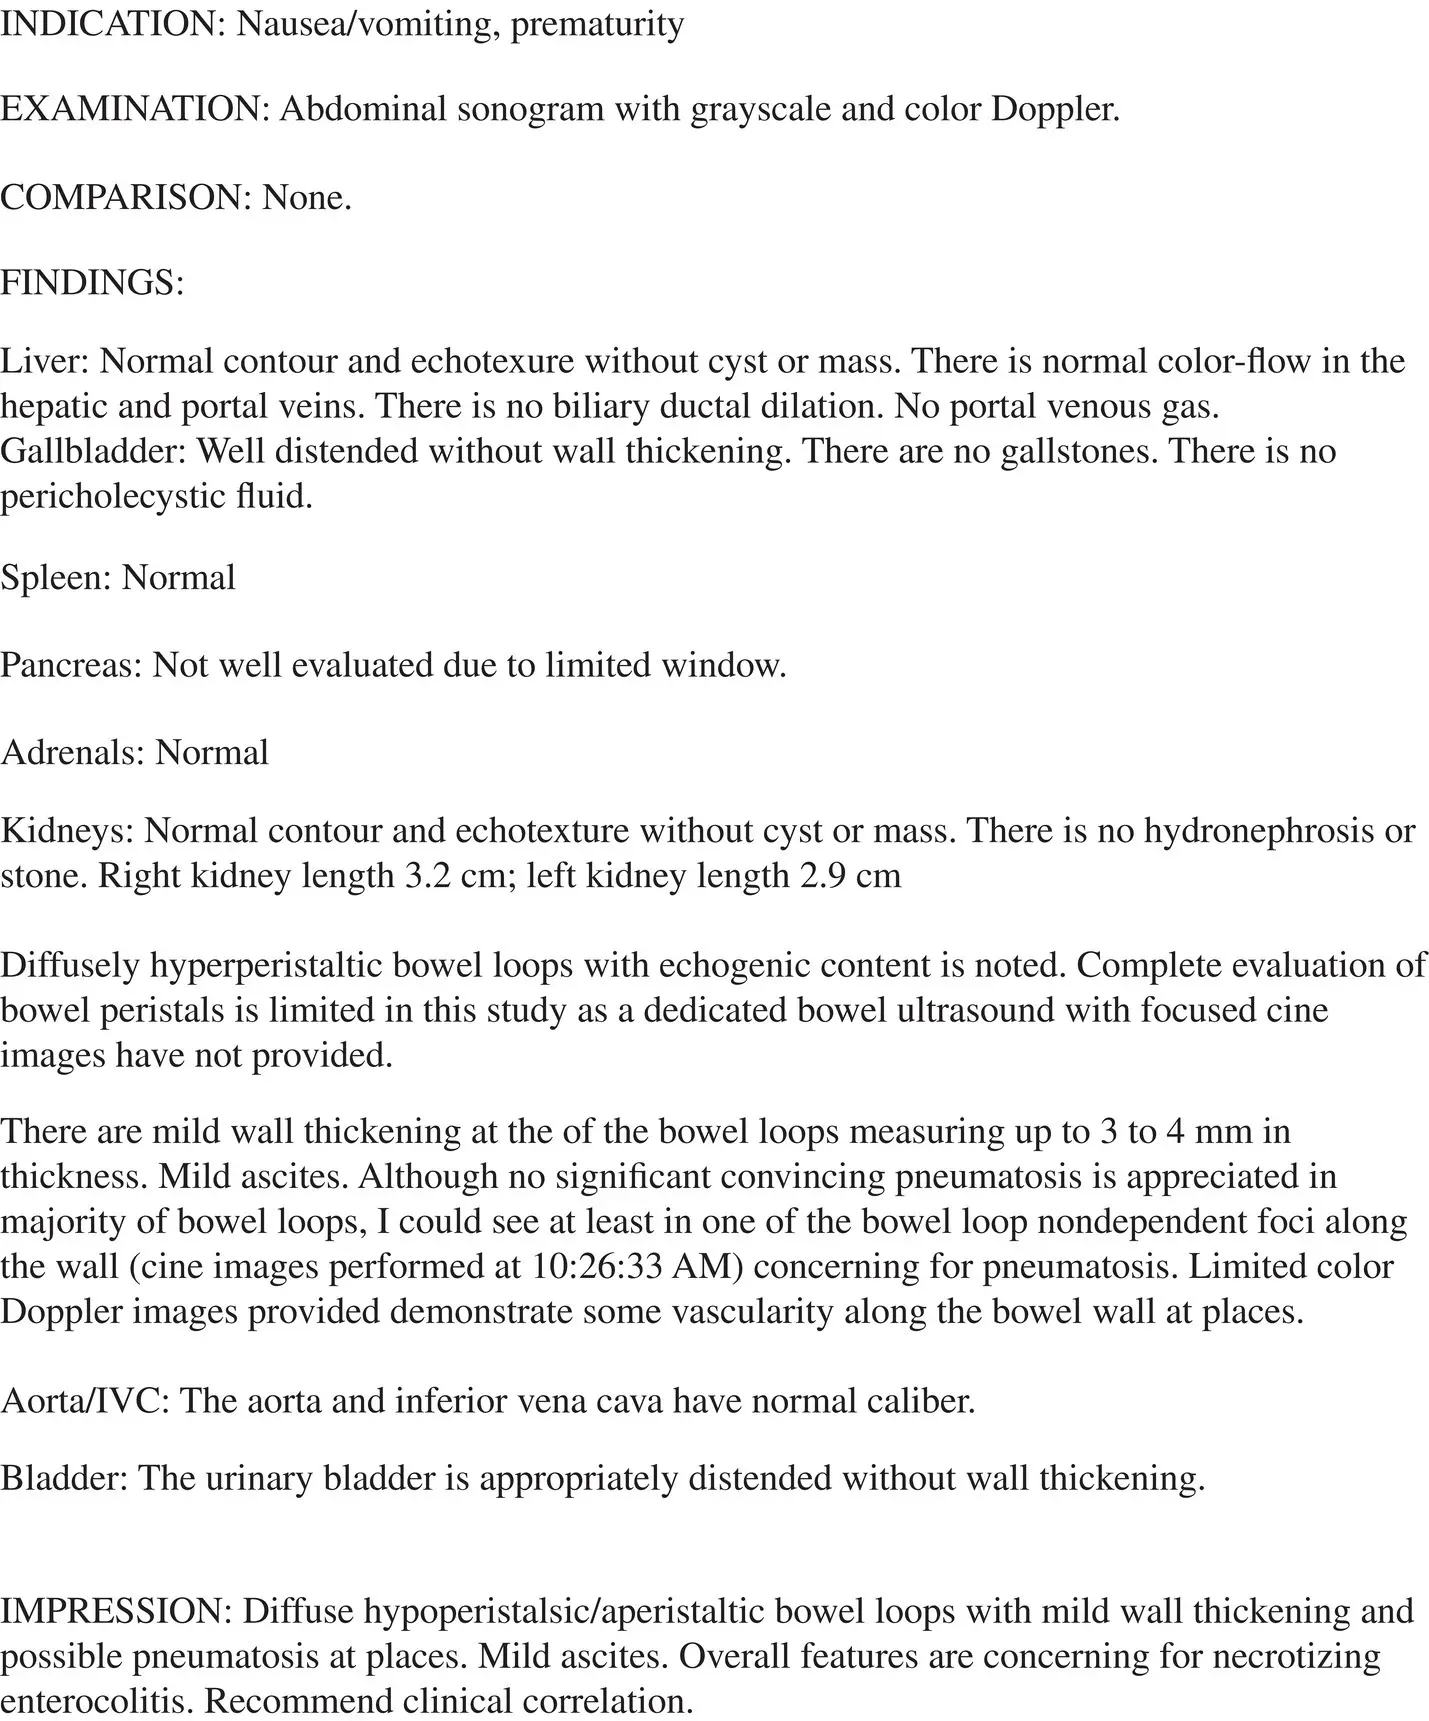
FIGURE 1.4 Radiological interpretation of abdominal ultrasound showing pneumatosis.
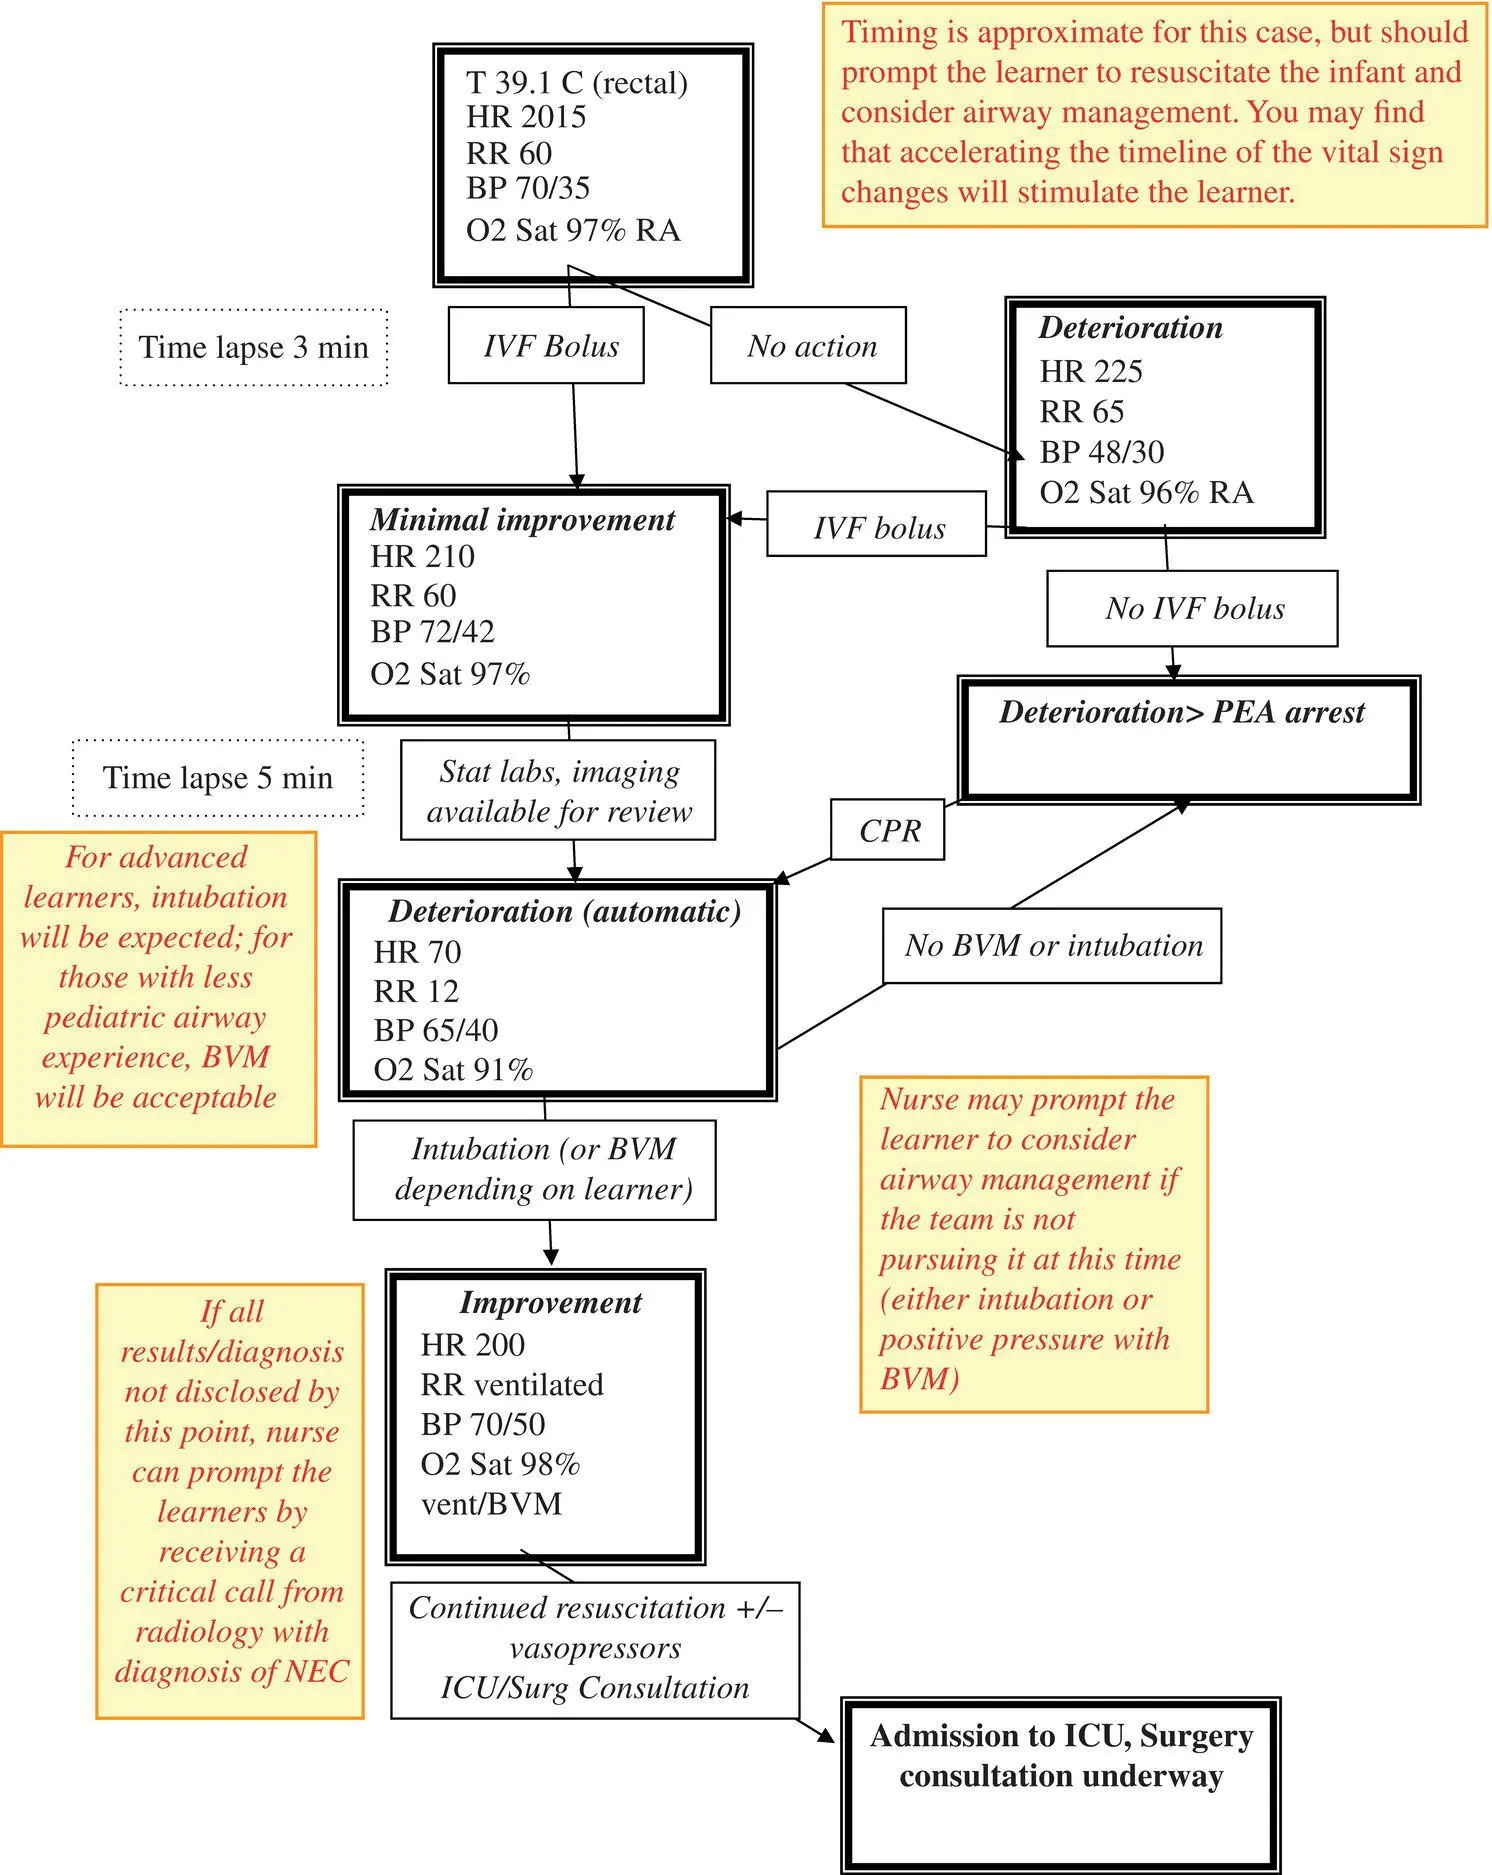
FIGURE 1.5 Flow diagram: necrotizing enterocolitis.
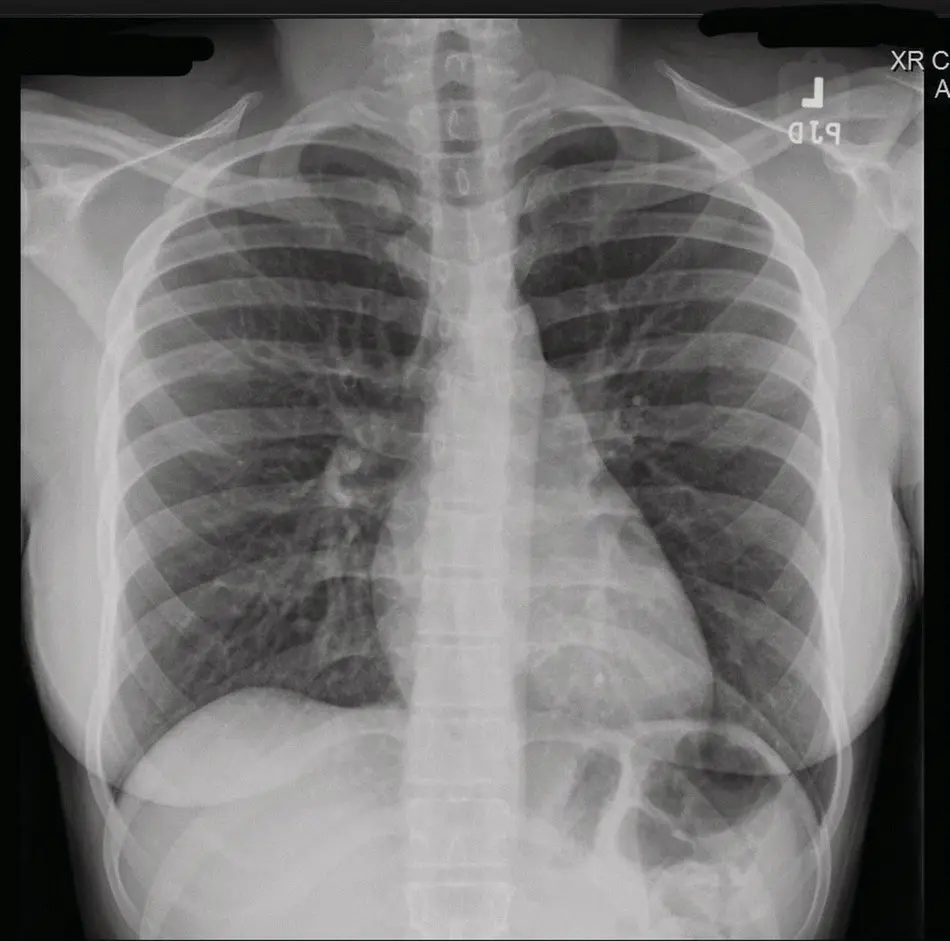
FIGURE 1.6 Chest x‐ray showing no active pulmonary disease.
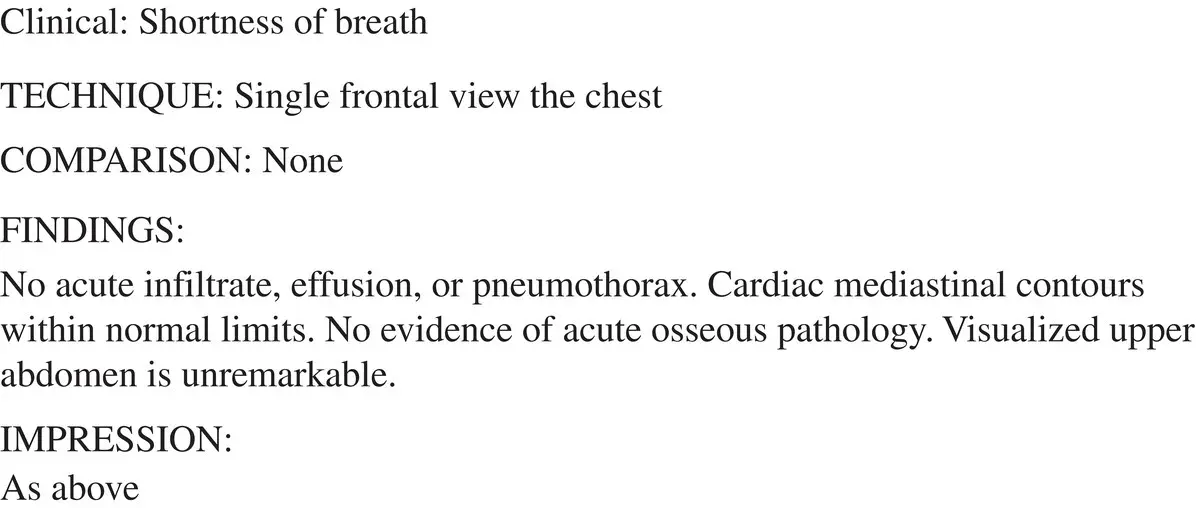
FIGURE 1.7 Radiological reading of chest x‐ray (normal).
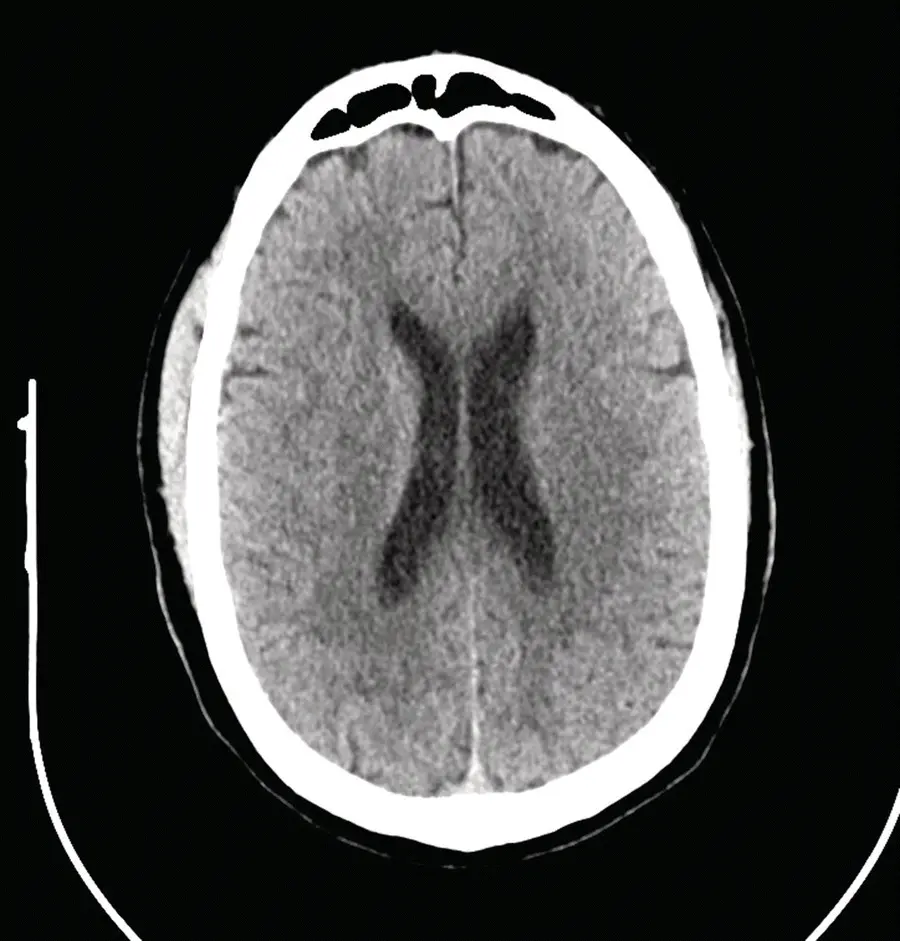
FIGURE 1.8 Head computed tomography (static image 1‐cut) showing no intracranial abnormality.
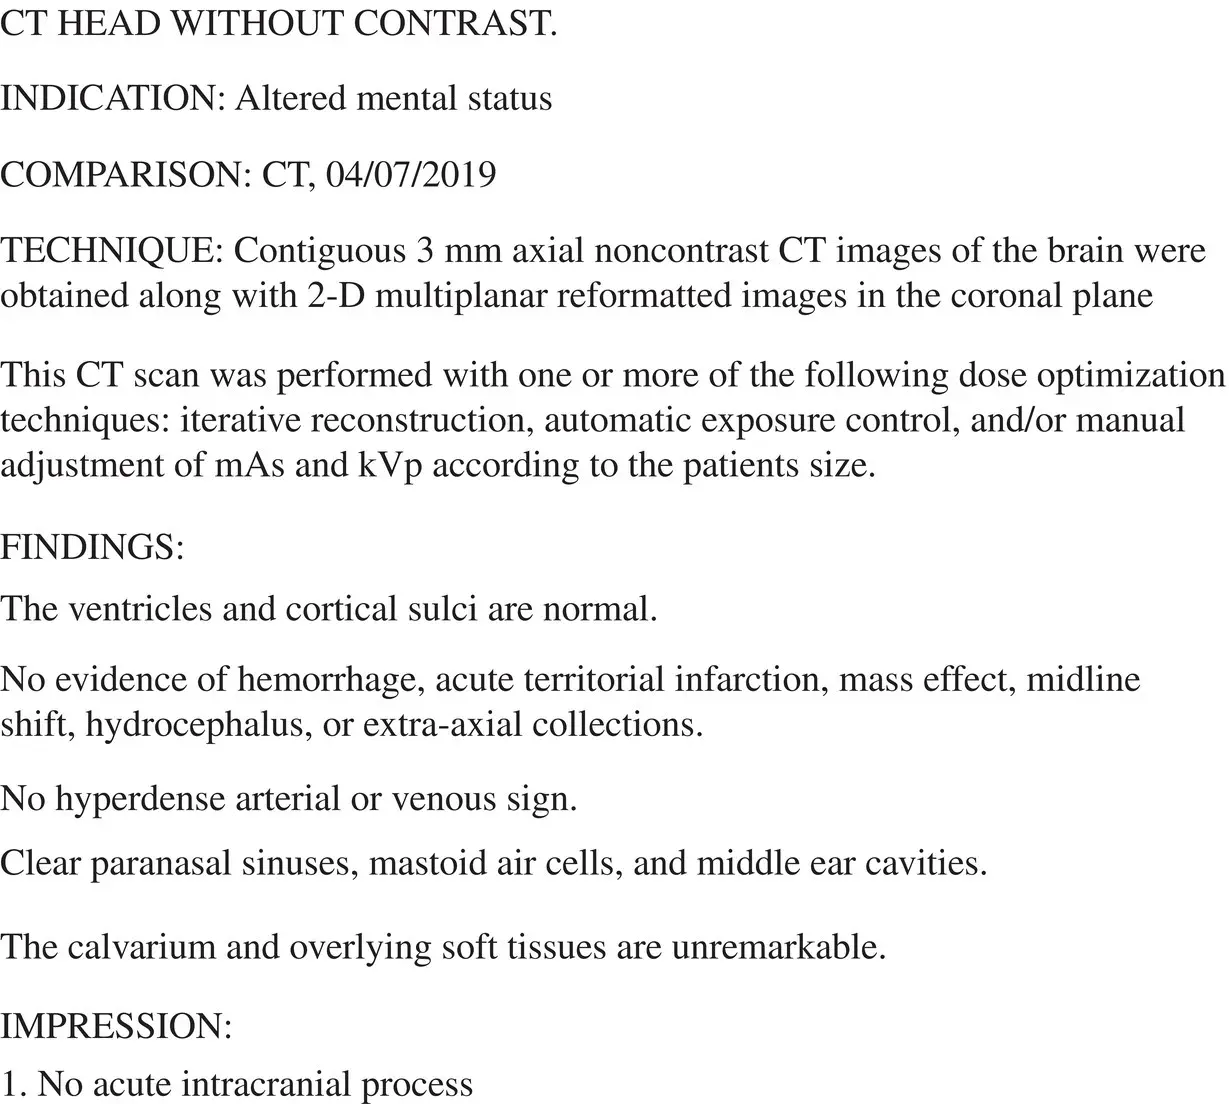
FIGURE 1.9 Radiology read computed tomography of the head (normal).
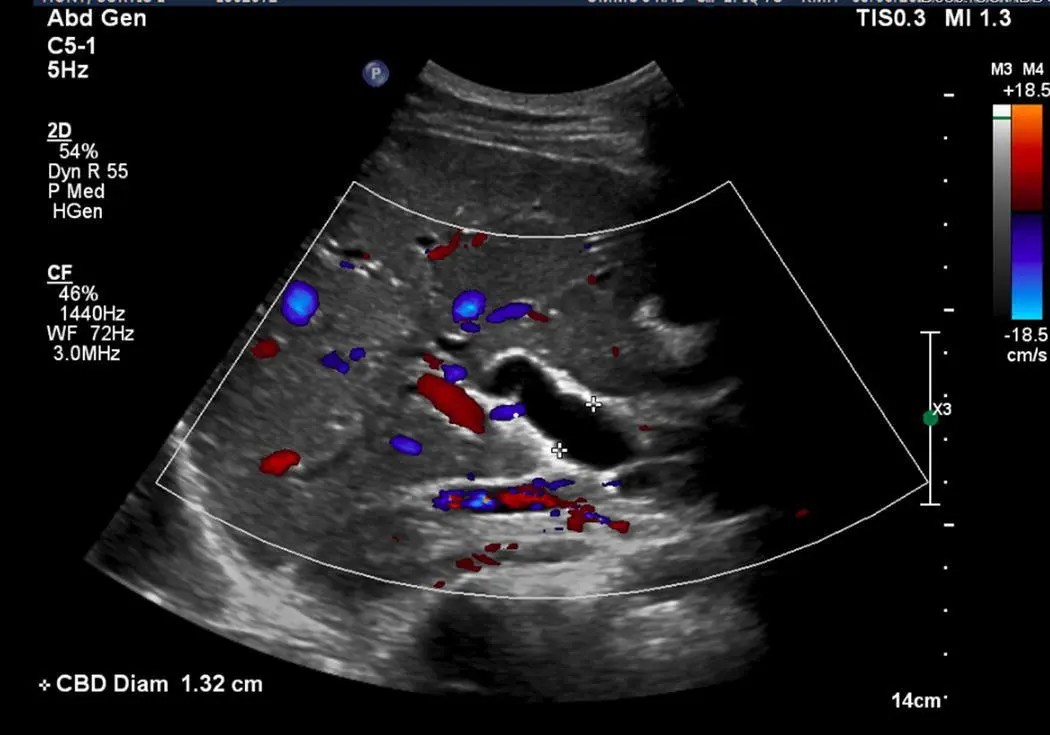
FIGURE 1.10 Ultrasound of right upper quadrant (static image) showing biliary dilation.
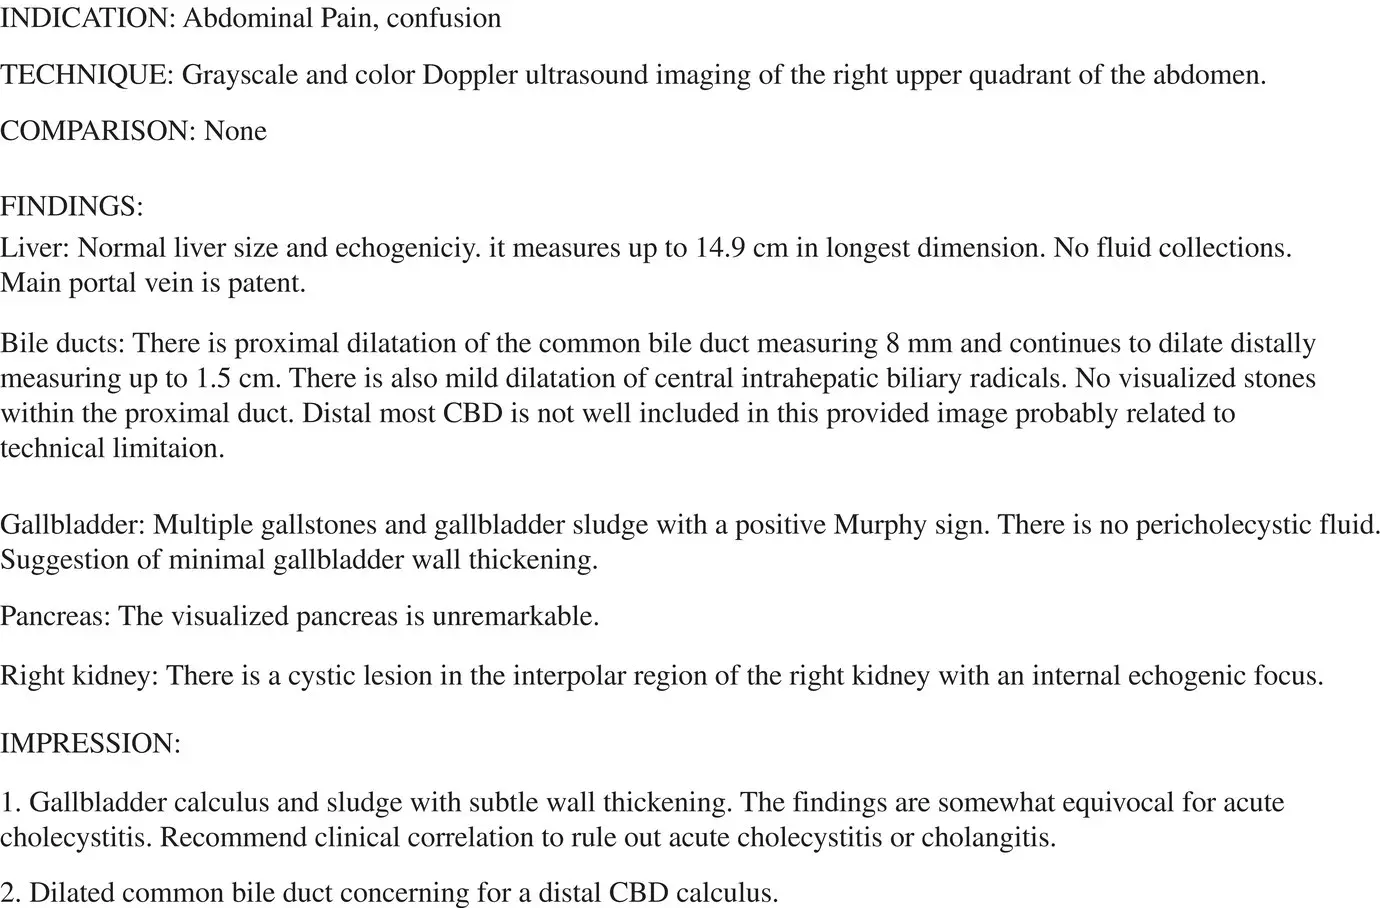
FIGURE 1.11 Radiology read showing biliary dilation concerning for choledocholithiasis.
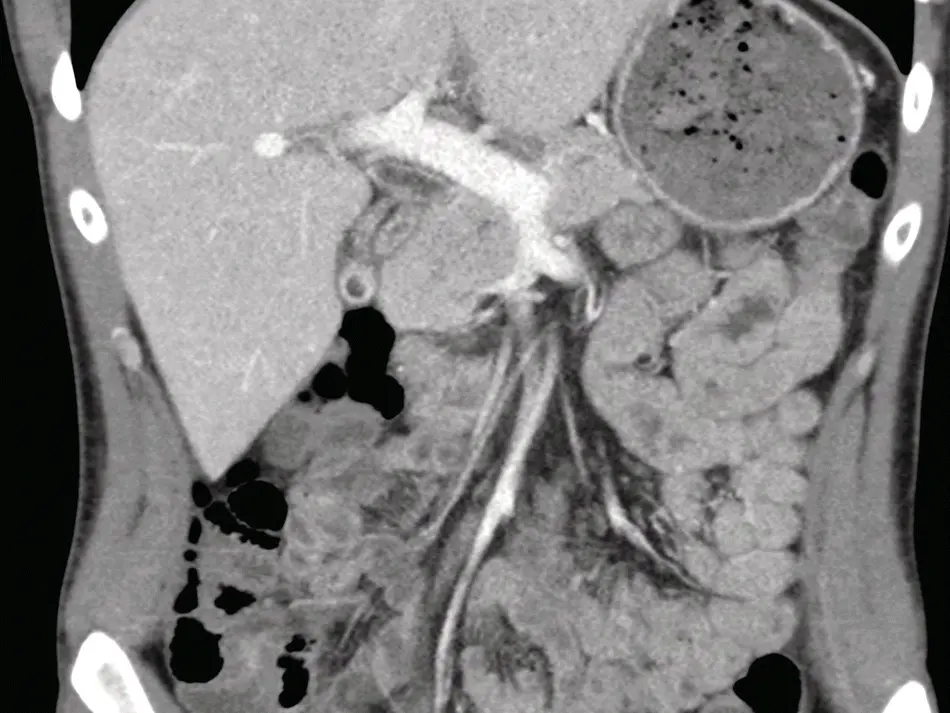
FIGURE 1.12 Computed tomography of the abdomen/pelvis with intravenous contrast (static image, 1‐cut) showing grossly dilated common bile duct.
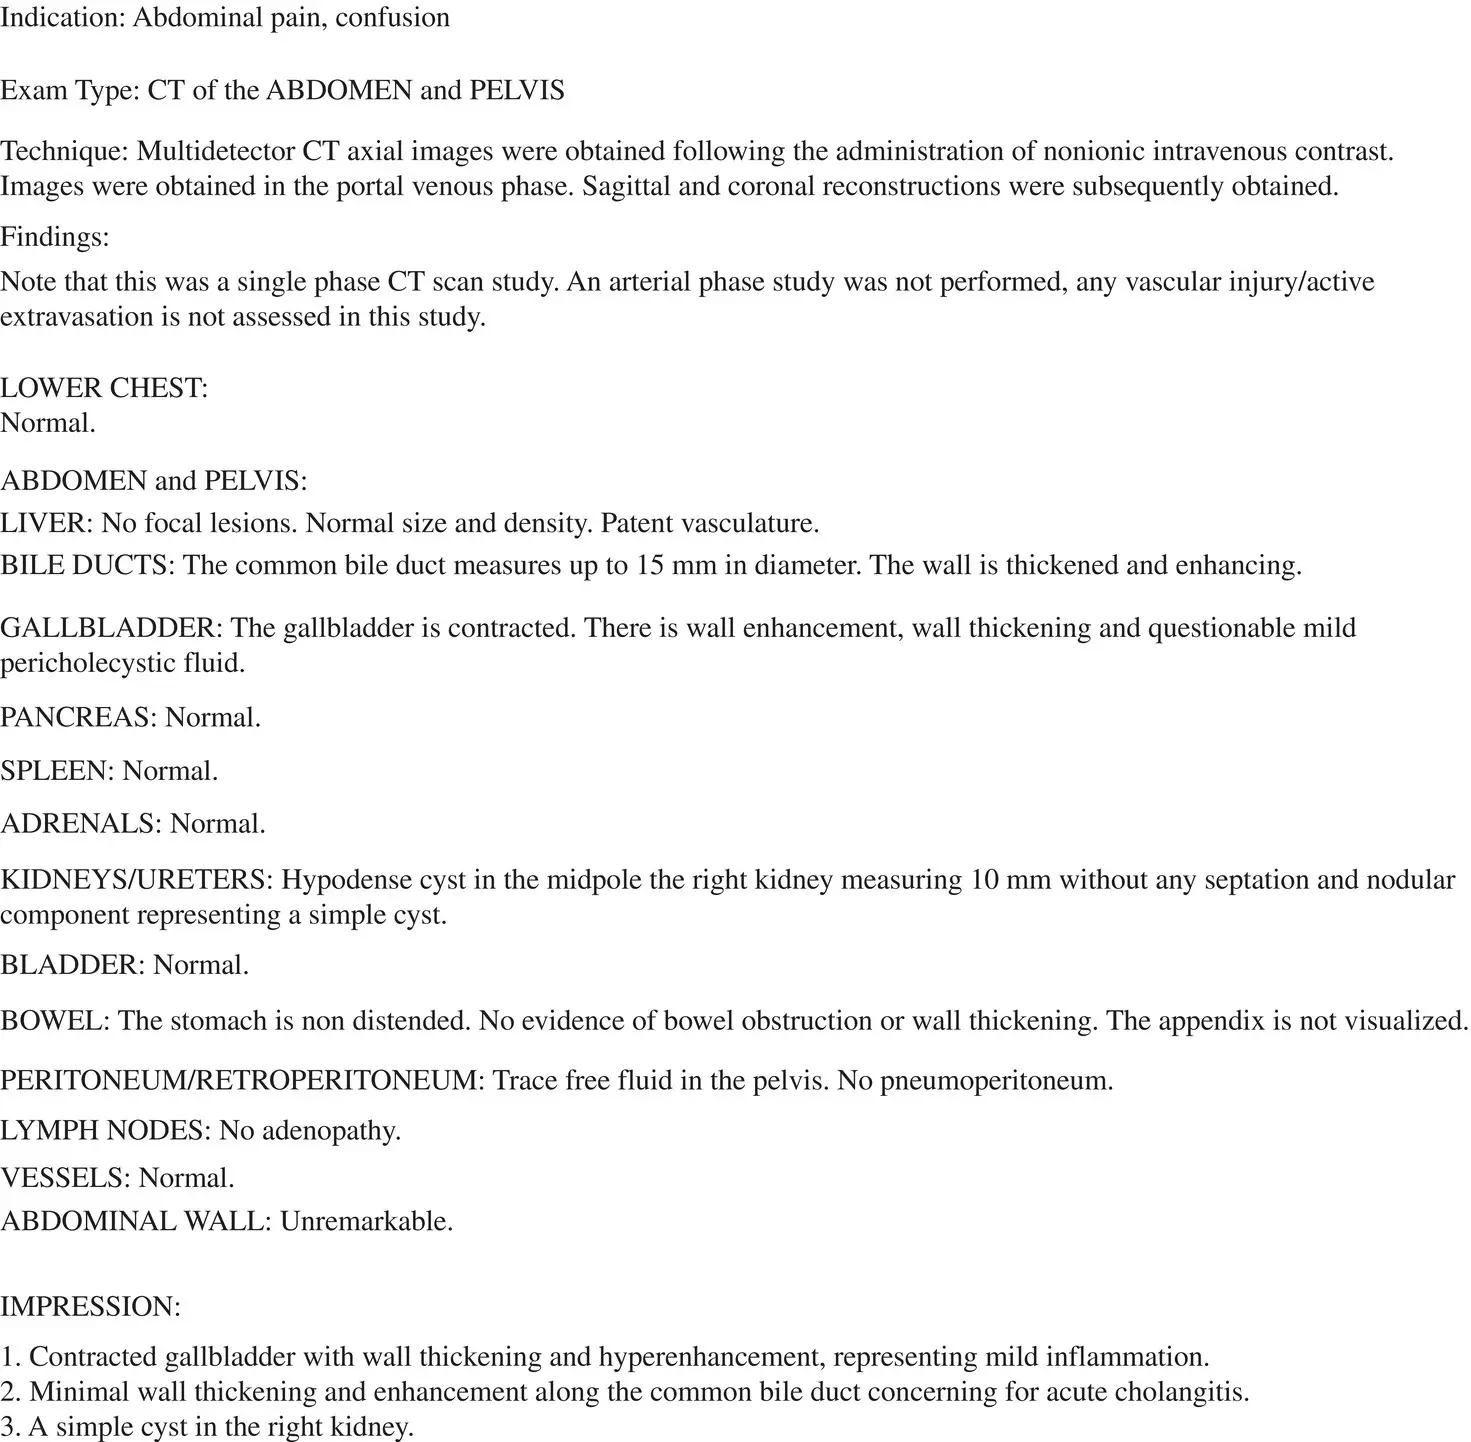
FIGURE 1.13 Computed tomography read concerning for acute cholangitis.
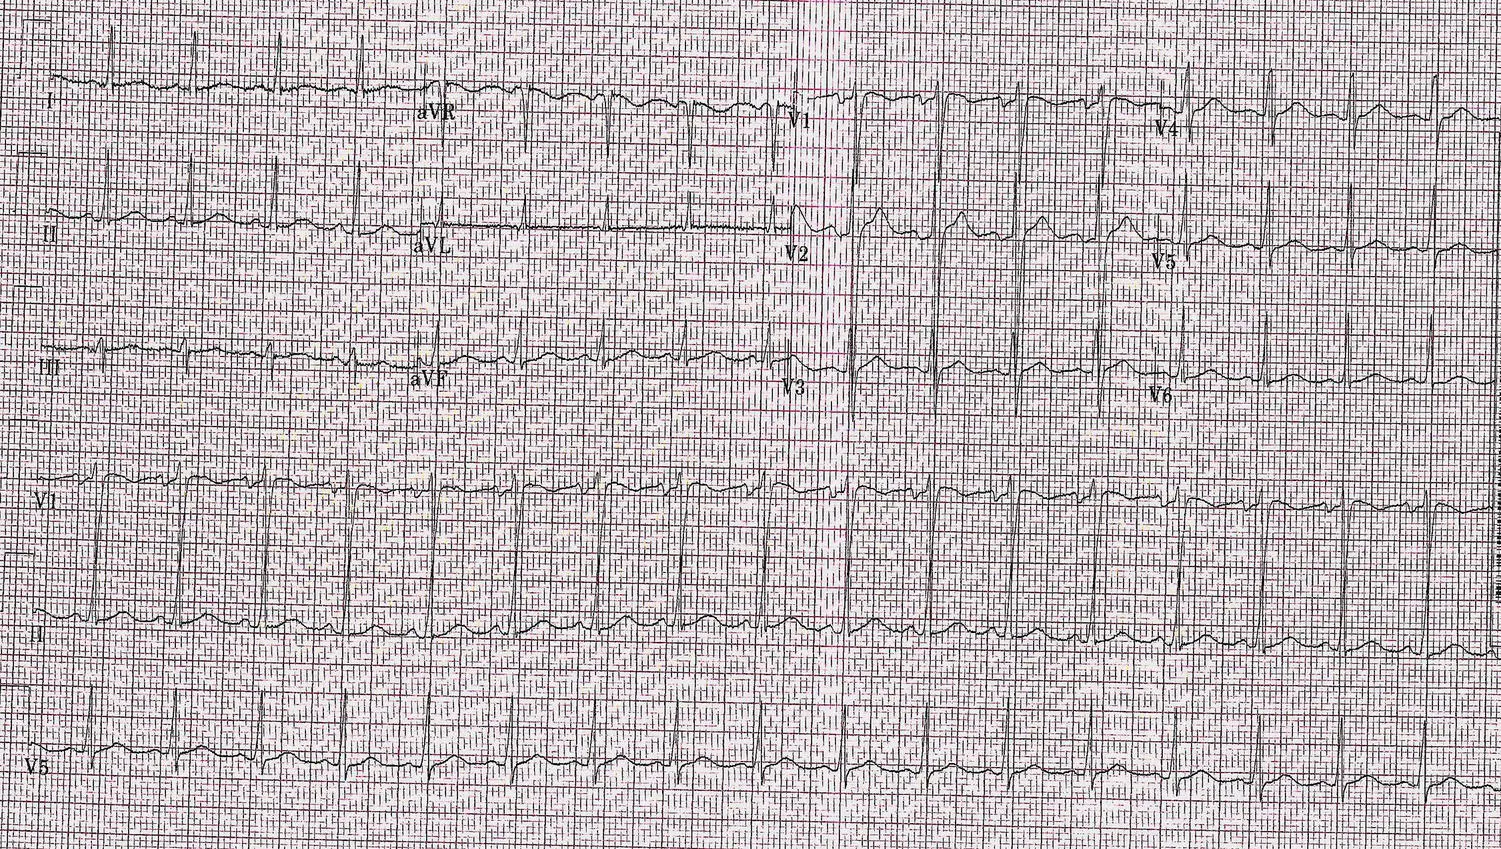
FIGURE 1.14 Electrocardiogram showing sinus tachycardia.
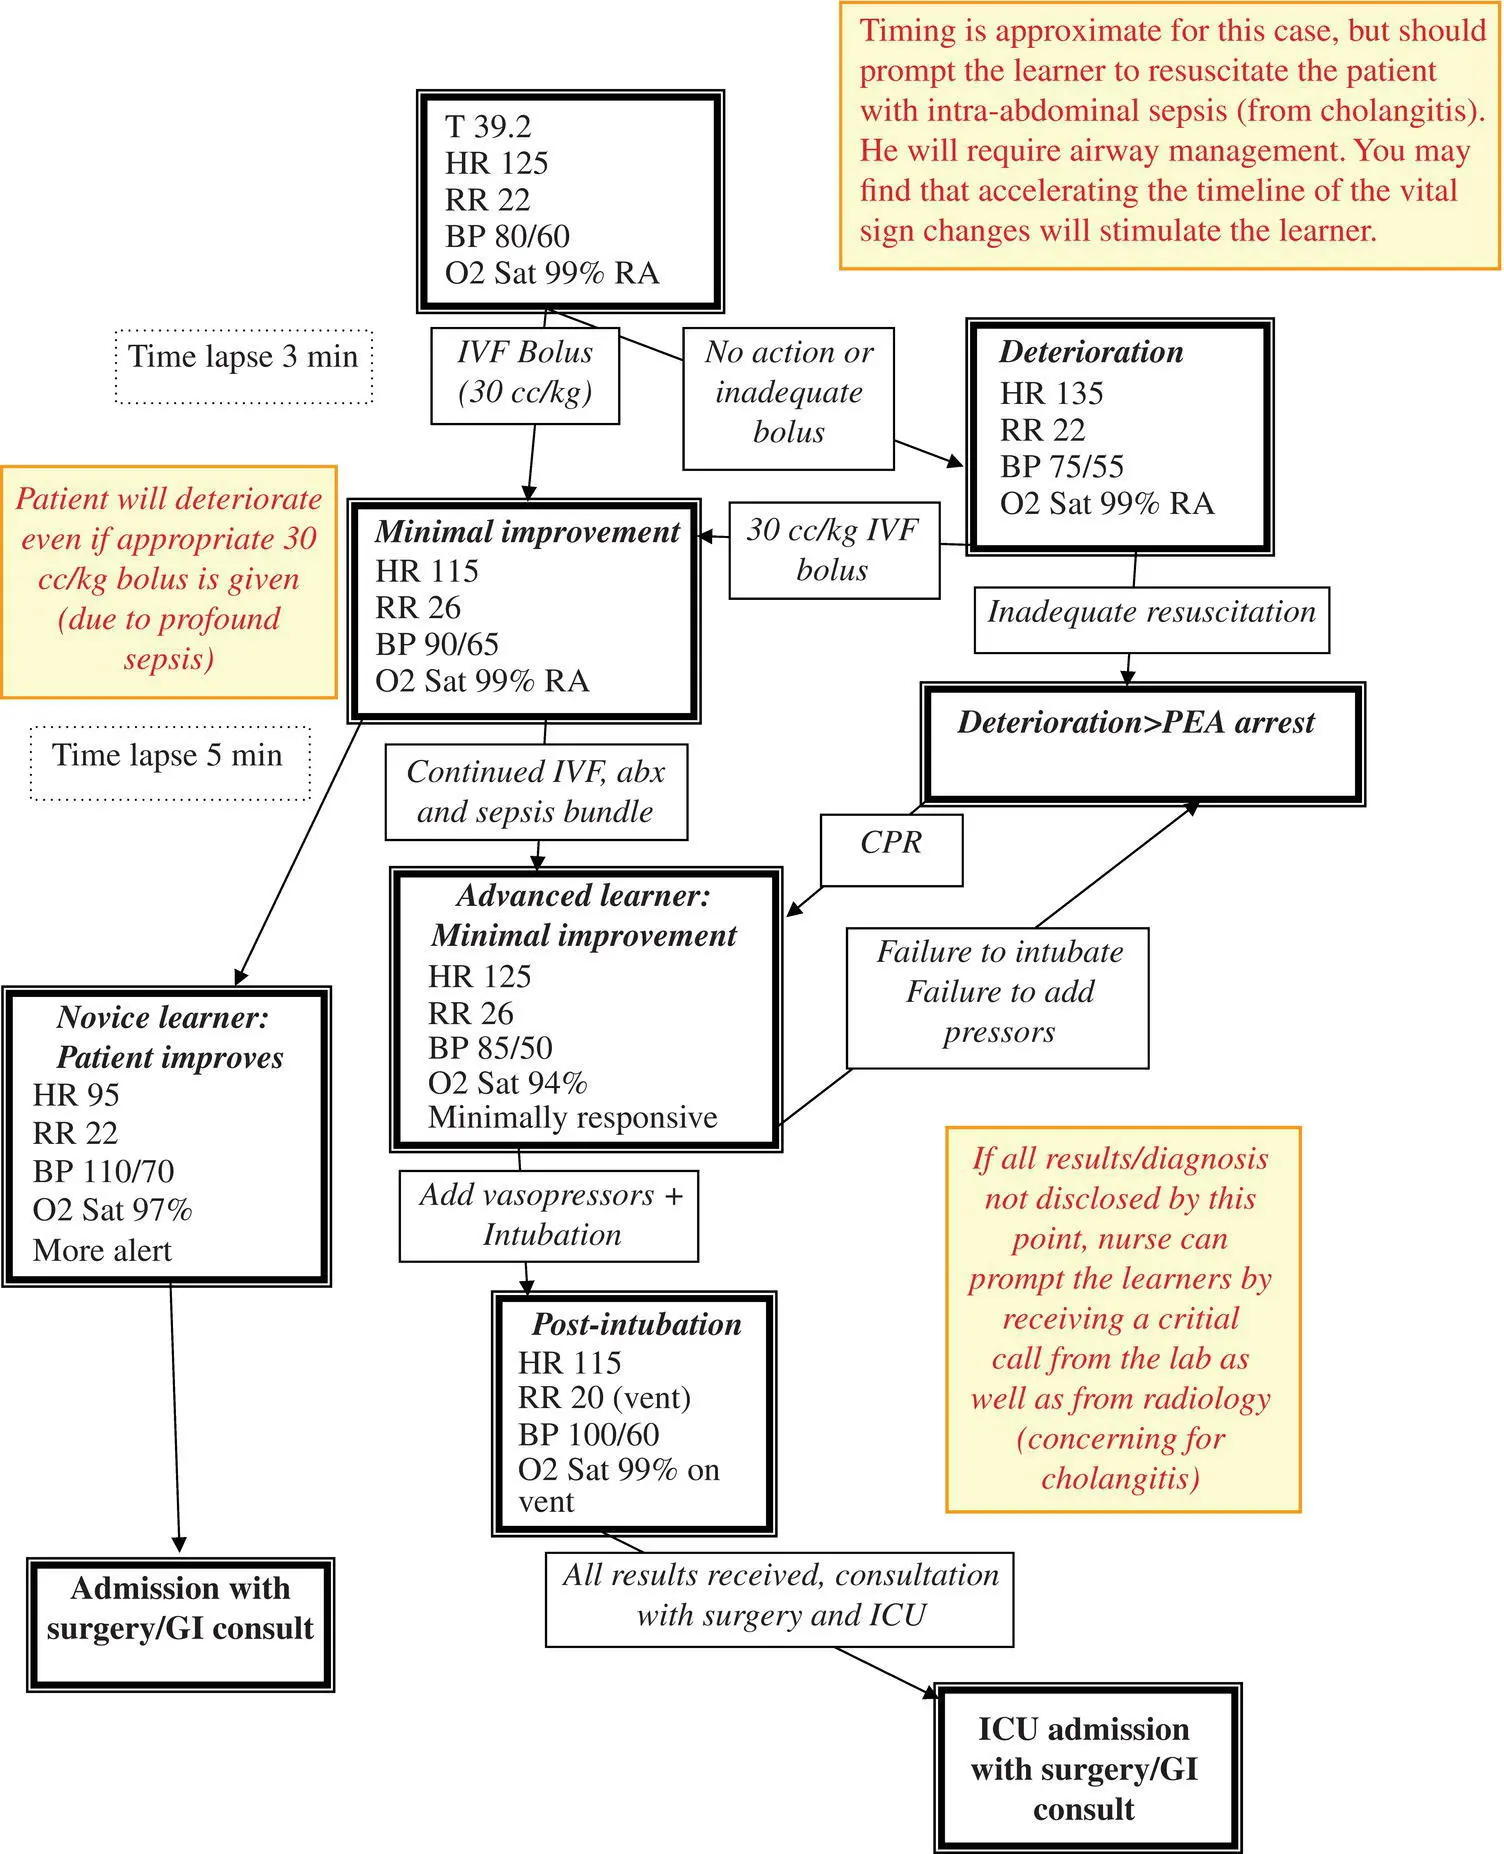
FIGURE 1.15 Flow diagram: ascending cholangitis.
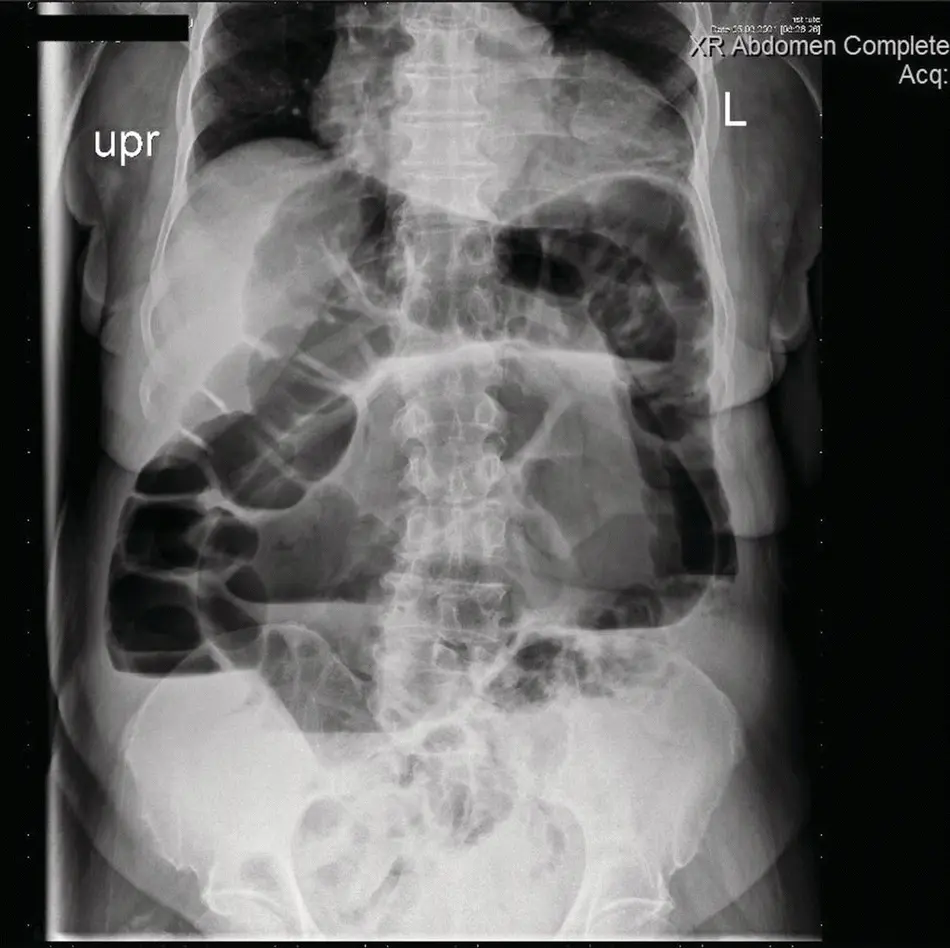
FIGURE 1.16 Abdominal x‐ray showing evidence of distended sigmoid colon.
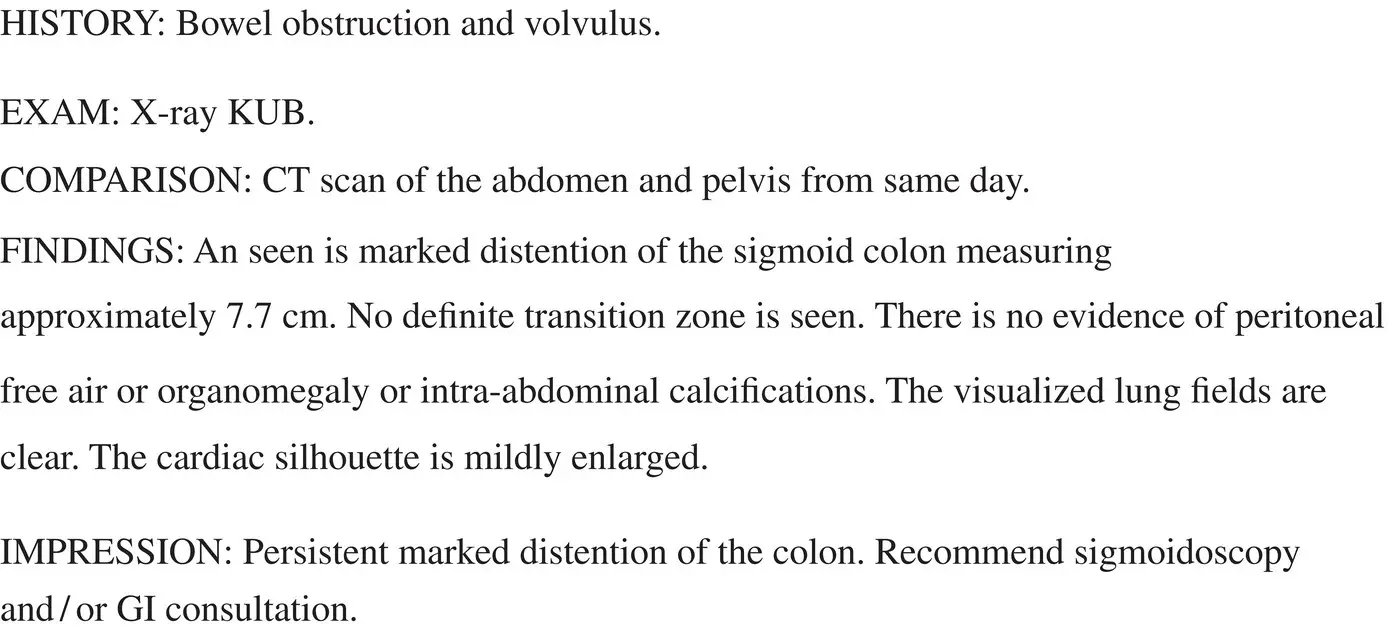
FIGURE 1.17 Radiological report of abdominal x‐ray.
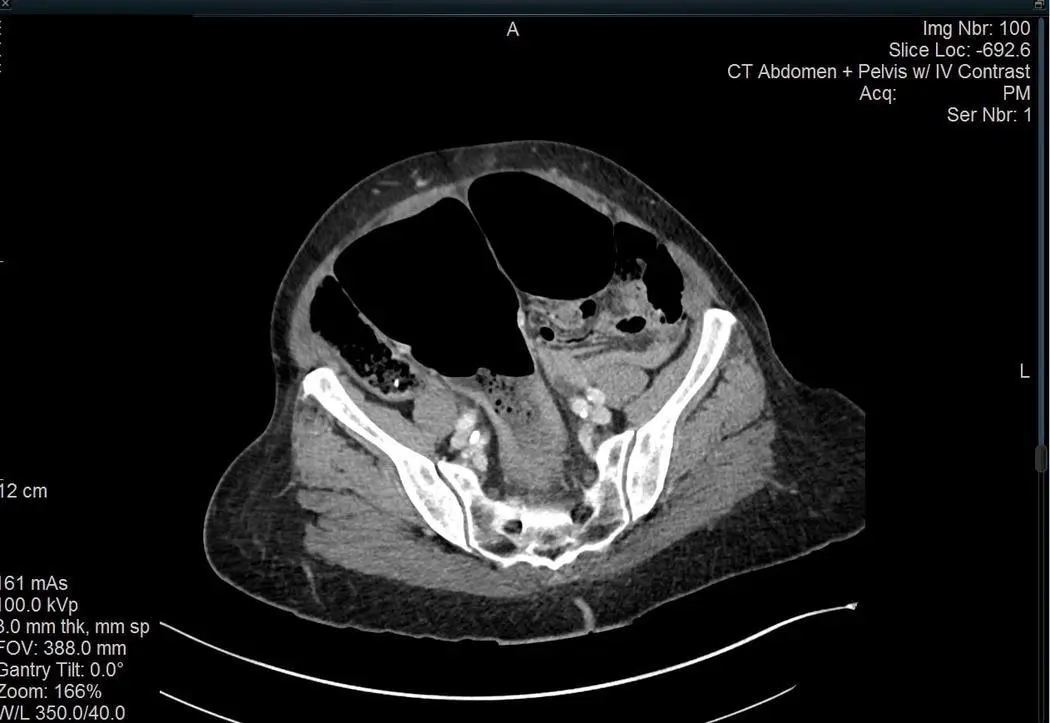
FIGURE 1.18 Computed tomography of the abdomen/pelvis with intravenous contrast (static image 1‐cut).

FIGURE 1.19 Radiological report of computed tomography showing sigmoid volvulus.
FIGURE 1.20 Electrocardiogram showing sinus tachycardia.
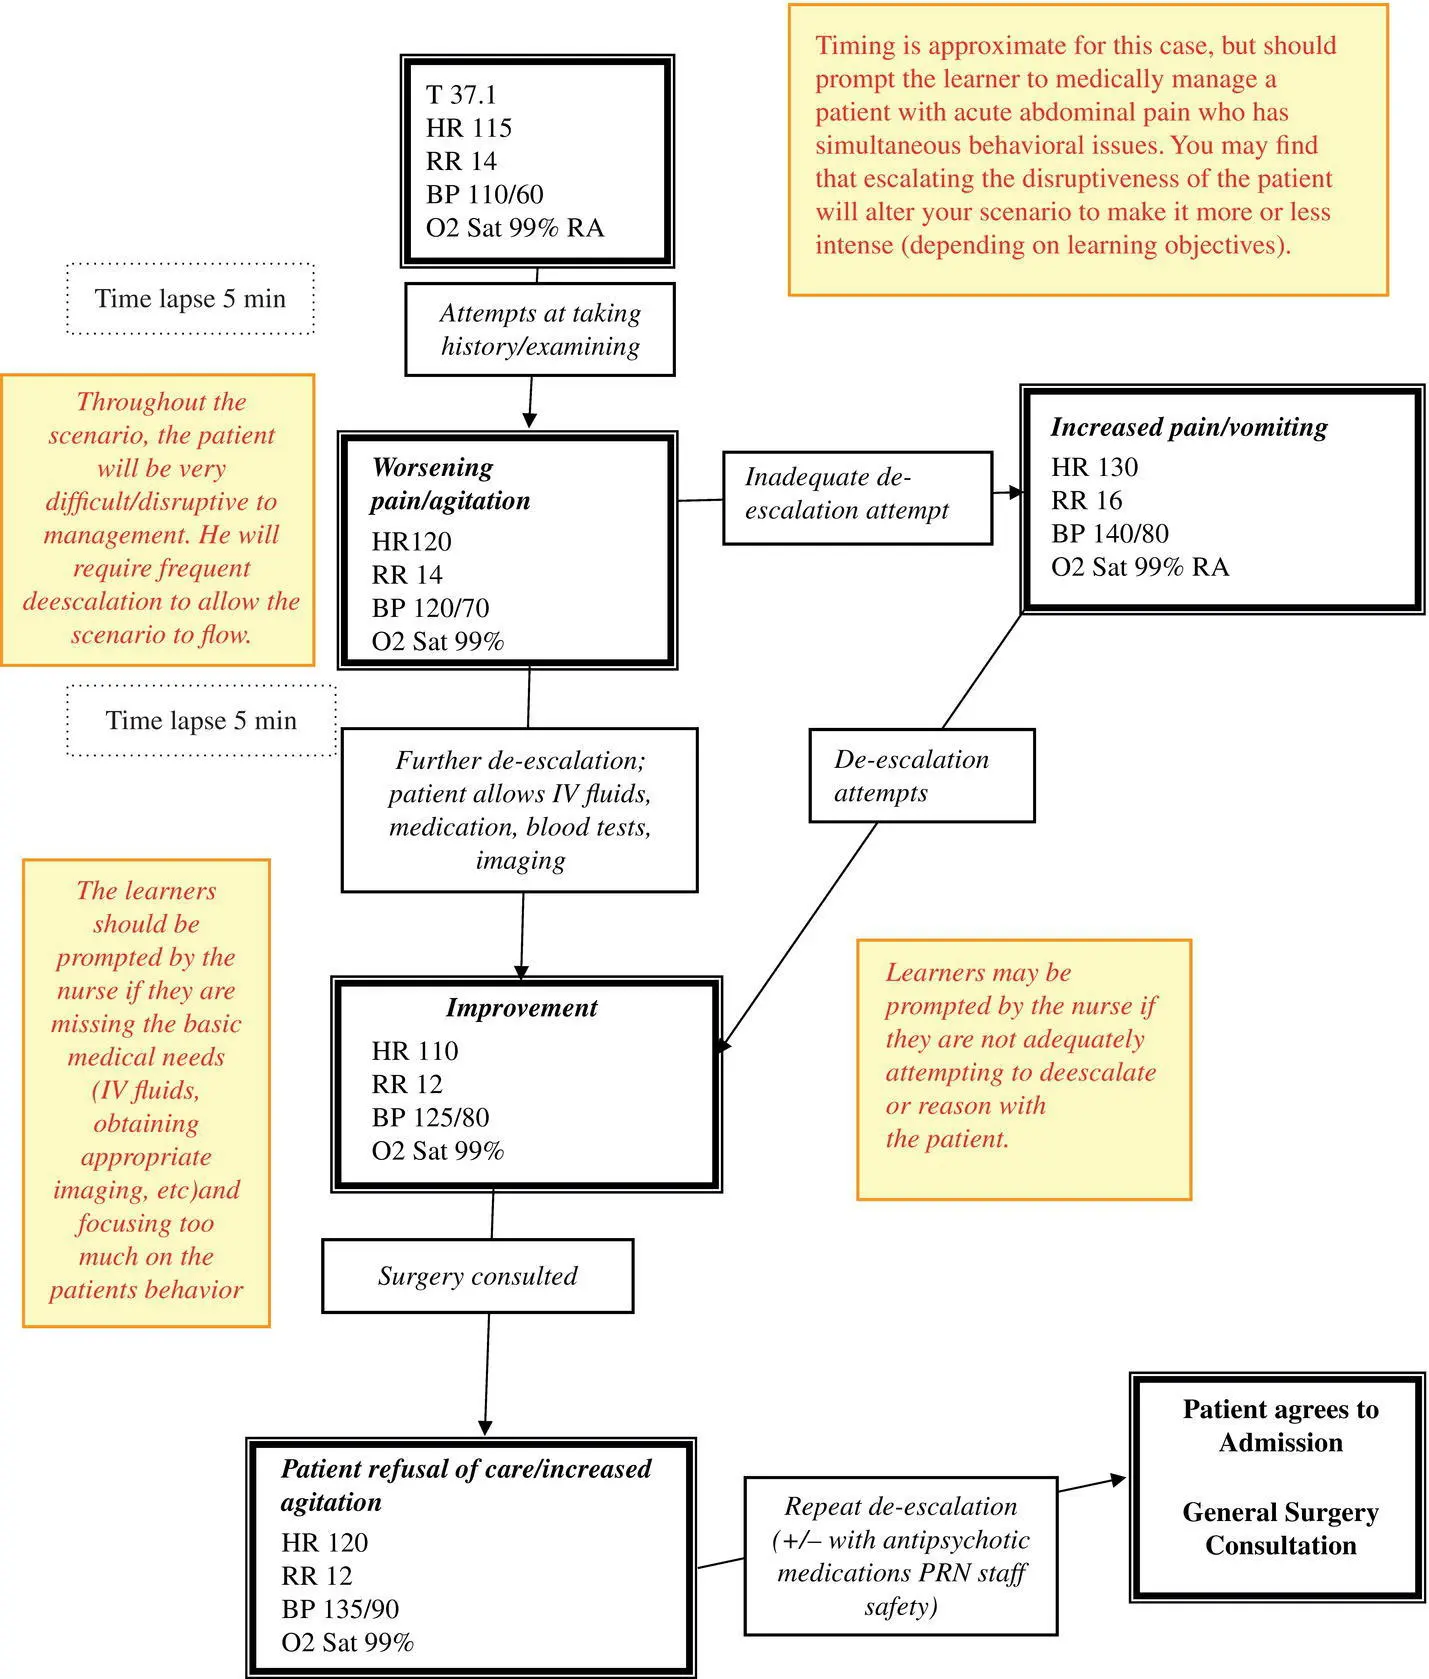
FIGURE 1.21 Flow diagram: sigmoid volvulus.
TABLE 1.1 Heelstick glucose.
| Test | Value | Reference range |
|---|---|---|
| Heelstick glucose (mg/dl) | 80 | 70–100 |
TABLE 1.2 Complete blood count.
| Test | Value | Reference range |
|---|---|---|
| White blood cells (× 10 000/μl) | 26.8 | 4.5–10.6 |
| Hemoglobin (g/dl) | 11 | 13.7–15.6 |
| Hematocrit (%) | 39 | 41–47 |
| Platelets (× 10 3/μl) | 90 | 150–475 |
TABLE 1.3 Basic metabolic panel.
| Test | Value | Reference range |
|---|---|---|
| Sodium (mmol/l) | 132 | 136–145 |
| Potassium (mmol/l) | 3.1 | 3.5–5.1 |
| Chloride (mmol/l) | 95 | 98–107 |
| CO 2(mmol/l) | 14 | 22–29 |
| Blood urea nitrogen (mg/dl) | 30 | 6–23 |
| Creatinine (mg/dl) | 1.2 | 0.7–1.2 |
| Glucose (mg/dl) | 78 | 70–100 |
TABLE 1.4 Liver function panel.
| Test | Value | Reference range |
|---|---|---|
| Aspartate aminotransferase (iu/l) | 35 | 5–40 |
| Alanine aminotransferase (iu/l) | 38 | 5–41 |
| Alkaline phosphatase (iu/l) | 100 | 40–129 |
| Total bilirubin (mg/dl) | 0.6 | 0.2–1 |
| Albumin (g/dl) | 3.2 | 3.5–4.2 |
TABLE 1.5 Lipase.
Читать дальшеИнтервал:
Закладка:
Похожие книги на «Emergency Medicine Simulation Workbook»
Представляем Вашему вниманию похожие книги на «Emergency Medicine Simulation Workbook» списком для выбора. Мы отобрали схожую по названию и смыслу литературу в надежде предоставить читателям больше вариантов отыскать новые, интересные, ещё непрочитанные произведения.


Обсуждение, отзывы о книге «Emergency Medicine Simulation Workbook» и просто собственные мнения читателей. Оставьте ваши комментарии, напишите, что Вы думаете о произведении, его смысле или главных героях. Укажите что конкретно понравилось, а что нет, и почему Вы так считаете.