Non-financial Risk Management in the Financial Industry
Здесь есть возможность читать онлайн «Non-financial Risk Management in the Financial Industry» — ознакомительный отрывок электронной книги совершенно бесплатно, а после прочтения отрывка купить полную версию. В некоторых случаях можно слушать аудио, скачать через торрент в формате fb2 и присутствует краткое содержание. Жанр: unrecognised, на английском языке. Описание произведения, (предисловие) а так же отзывы посетителей доступны на портале библиотеки ЛибКат.
- Название:Non-financial Risk Management in the Financial Industry
- Автор:
- Жанр:
- Год:неизвестен
- ISBN:нет данных
- Рейтинг книги:5 / 5. Голосов: 1
-
Избранное:Добавить в избранное
- Отзывы:
-
Ваша оценка:
Non-financial Risk Management in the Financial Industry: краткое содержание, описание и аннотация
Предлагаем к чтению аннотацию, описание, краткое содержание или предисловие (зависит от того, что написал сам автор книги «Non-financial Risk Management in the Financial Industry»). Если вы не нашли необходимую информацию о книге — напишите в комментариях, мы постараемся отыскать её.
This handbook analyses a major success factor necessary for meeting the requirements of modern risk management: an institution-specific target operating model (TOM) – integrating strategy, governance & organisation, risk management, data architecture and cultural elements to ensure maximum effectiveness. Also, institutions need to master the digital transformation for their business model to be sufficiently sustainable for the years to come. This book will offer ways on how to achieve just that.
The book has been written by senior ESG, Compliance and NFR experts from key markets in Europe, the U.S. and Asia. It gives practitioners the necessary guidance to master the challenges in today's global risk environment. Each chapter covers key regulatory requirements, major implementation challenges as well as both practical solutions and examples.
Non-financial Risk Management in the Financial Industry — читать онлайн ознакомительный отрывок
Ниже представлен текст книги, разбитый по страницам. Система сохранения места последней прочитанной страницы, позволяет с удобством читать онлайн бесплатно книгу «Non-financial Risk Management in the Financial Industry», без необходимости каждый раз заново искать на чём Вы остановились. Поставьте закладку, и сможете в любой момент перейти на страницу, на которой закончили чтение.
Интервал:
Закладка:
A complaint shall be considered “overdue” when it takes longer than the target time the company establishes as maximum time to address a complaint.
3.4.2 KRIs: setting and calibrating the thresholds
For each risk indicator, different tolerance levels are defined, with the aim of providing straightforward, actionable guidance on how to evaluate the current situation – i.e. whether observed performance is ordinary or whether it is a symptom of emerging anomalies. The definition of thresholds at KRI level addresses the mandate expressed by the regulator, as risk limits are expected to be specific, measurable and reportable. [10]
As a matter of fact, RAFs bridge risk prioritisation coming from risk assessments (i.e. specific areas of focus) with operational KRI-based reporting and specific thresholds to activate remedial actions.
The process is usually articulated in the following three steps:
Historical data analysisThe core of threshold setting, in line with regulator’s recommendations to “avoid defining limits only based on market references or existing regulatory limits.” [11]
Fine-tuning through peers’ benchmarking and back-testingMostly used to identify potential adjustments to the thresholds defined through the historical data analysis.
Expert judgementThresholds identified are typically refined based on expert insights, which embed, for example, market practice, regulatory guidance, relevant changes in the business model.
Given possible deficiencies in the internal data sources available (e.g. limited sample with few data points, high variability in distribution with large difference between minimum and maximum values for a given risk), financial institutions may decide to run simulations, to compare and identify the most suitable and robust methodology to apply.
Pragmatic examples of these three steps are provided below.
3.4.2.1 Threshold calibration based on historical data analysis and percentiles
A possible approach for calibration relies on the analysis of the historical data of a selected KRI; the thresholds are then defined on selected percentiles of the value distributions. The percentile distribution approach is often considered a suitable option since it offers a dynamic risk factor assessment. The distribution is constantly updated as new data enters the dataset, thus allowing for a better representation of the evolution of the underlying risk factor.
Under an operational point of view, the percentile approach consists of three main steps:
1 Building of the dataset through the calculation of the KRI values (e.g. number of non-domestic customers resident in high-risk countries/total number of clients of all the legal entities within scope). It is important to leverage a sufficiently long set of reliable data series (for example, one large EU bank started with three years of data), to avoid having flat distributions potentially characterised by higher volatility; the resulting distributions may, in fact, lead to set thresholds that are triggered all too often.
2 Computation of the KRI distributionThe KRI dataset must then be sorted from the lowest to the highest value, typically having higher percentiles corresponding to riskier values.In order to avoid having too many outlier values, it is important to consider homogenous data for the sample; in case of too heterogeneous data, it could be worth dividing the distribution into sub-distributions based on the characteristics of data (e.g. dividing customers into financial institutions and corporates, or small and large customers). The thresholds shall then be calculated for each of the sub-distributions.
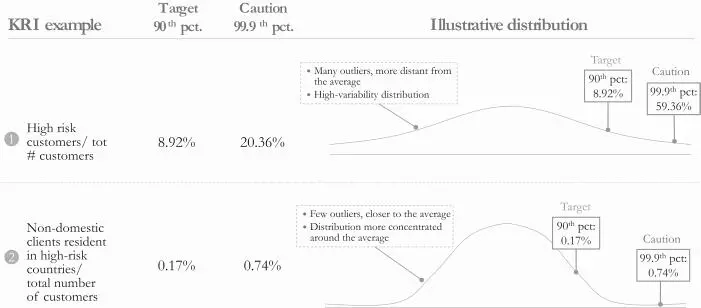
3 Choice of percentiles for limit, caution and target thresholdsThe limit threshold should be set to contain the extreme values observed in the distribution. Most often simulations and backtestings are run in order to estimate the frequency of breaches of the selected limit threshold: this, in fact, in business-as-usual conditions should be triggered only on rare and high-risk occasions. Nonetheless, percentiles are also typically set in accordance with the institution internal broader RAF methodology, in order to have a consistent approach for the various risks managed within the RAF.The caution threshold should be set considering two main aspects:i.How frequently, in history, the breach of the caution threshold then actually led to the breach of a limit threshold, in order to have a significative caution threshold breach.ii.How long would it take to implement timely risk mitigating actions: the threshold should thus be set in order to allow the respective function to undertake the remedial action in a timely manner.Finally, the target threshold should be set based on the risk appetite for the specific KRI that the control function, jointly with the first line, is willing to accept under business-as-usual conditions, and accordingly with overall risk appetite.
Figure 8:Example of thresholds calibration applying a percentile-based approach
3.4.2.2 Threshold fine-tuning based on benchmarking and backtesting
Historical analysis run to determine the percentile to use for the Level 3 KRI thresholds should be complemented by peers’ benchmark analysis and backtesting. These activities may lead to the fine-tuning of the defined thresholds, with the aim of better capturing both market practices and the financial institution’s specificities.
A benchmark analysis among market peers on the selected KRI will determine the tolerances thresholds most widely in use. If the benchmark pool and the bank are comparable in size and business, the threshold for the selected KRI should be within this value range.
Backtesting should be performed to assess the relevance of selected thresholds in terms of frequency of incurrence. As an example, the analysis could highlight that, having set a specific threshold, over the past ten years too many breaches would have occurred. This could encourage the adjustment of the threshold so that the thresholds correctly identify the values which they are aimed at (e.g. extreme values).
Table 6:Example of KRI threshold calibration and fine-tuning
1 – Large EU Banking GroupThe bank needed to set the limit, caution and target thresholds for the following KRI:  The bank firstly determined its data series collecting data points from all legal entities in the group and adding them to the data series of the previous two years. Then two different distributions were carved out of the original one: the first one referred to large company customers, the second one to small-size company customers. In accordance with the overall RAF methodology, the bank set the following thresholds: Target: values in 80 th–90 thpercentile. Caution: values above the 95 thbut below the 99 thpercentile. Limit: value above the 99 thpercentile. This setting was backed up by simulations and backtesting, which showed that a breach would have occurred only three times in the past three years, thus being consistent with the definition of extreme values. Furthermore, a benchmark analysis was run, and it confirmed that the main market peers, comparable for volume of transactions and geographical fragmentation of business, used the same thresholds on average. The bank firstly determined its data series collecting data points from all legal entities in the group and adding them to the data series of the previous two years. Then two different distributions were carved out of the original one: the first one referred to large company customers, the second one to small-size company customers. In accordance with the overall RAF methodology, the bank set the following thresholds: Target: values in 80 th–90 thpercentile. Caution: values above the 95 thbut below the 99 thpercentile. Limit: value above the 99 thpercentile. This setting was backed up by simulations and backtesting, which showed that a breach would have occurred only three times in the past three years, thus being consistent with the definition of extreme values. Furthermore, a benchmark analysis was run, and it confirmed that the main market peers, comparable for volume of transactions and geographical fragmentation of business, used the same thresholds on average. |
3.5 RAF Governance
Интервал:
Закладка:
Похожие книги на «Non-financial Risk Management in the Financial Industry»
Представляем Вашему вниманию похожие книги на «Non-financial Risk Management in the Financial Industry» списком для выбора. Мы отобрали схожую по названию и смыслу литературу в надежде предоставить читателям больше вариантов отыскать новые, интересные, ещё непрочитанные произведения.


Обсуждение, отзывы о книге «Non-financial Risk Management in the Financial Industry» и просто собственные мнения читателей. Оставьте ваши комментарии, напишите, что Вы думаете о произведении, его смысле или главных героях. Укажите что конкретно понравилось, а что нет, и почему Вы так считаете.