Non-financial Risk Management in the Financial Industry
Здесь есть возможность читать онлайн «Non-financial Risk Management in the Financial Industry» — ознакомительный отрывок электронной книги совершенно бесплатно, а после прочтения отрывка купить полную версию. В некоторых случаях можно слушать аудио, скачать через торрент в формате fb2 и присутствует краткое содержание. Жанр: unrecognised, на английском языке. Описание произведения, (предисловие) а так же отзывы посетителей доступны на портале библиотеки ЛибКат.
- Название:Non-financial Risk Management in the Financial Industry
- Автор:
- Жанр:
- Год:неизвестен
- ISBN:нет данных
- Рейтинг книги:5 / 5. Голосов: 1
-
Избранное:Добавить в избранное
- Отзывы:
-
Ваша оценка:
Non-financial Risk Management in the Financial Industry: краткое содержание, описание и аннотация
Предлагаем к чтению аннотацию, описание, краткое содержание или предисловие (зависит от того, что написал сам автор книги «Non-financial Risk Management in the Financial Industry»). Если вы не нашли необходимую информацию о книге — напишите в комментариях, мы постараемся отыскать её.
This handbook analyses a major success factor necessary for meeting the requirements of modern risk management: an institution-specific target operating model (TOM) – integrating strategy, governance & organisation, risk management, data architecture and cultural elements to ensure maximum effectiveness. Also, institutions need to master the digital transformation for their business model to be sufficiently sustainable for the years to come. This book will offer ways on how to achieve just that.
The book has been written by senior ESG, Compliance and NFR experts from key markets in Europe, the U.S. and Asia. It gives practitioners the necessary guidance to master the challenges in today's global risk environment. Each chapter covers key regulatory requirements, major implementation challenges as well as both practical solutions and examples.
Non-financial Risk Management in the Financial Industry — читать онлайн ознакомительный отрывок
Ниже представлен текст книги, разбитый по страницам. Система сохранения места последней прочитанной страницы, позволяет с удобством читать онлайн бесплатно книгу «Non-financial Risk Management in the Financial Industry», без необходимости каждый раз заново искать на чём Вы остановились. Поставьте закладку, и сможете в любой момент перейти на страницу, на которой закончили чтение.
Интервал:
Закладка:
Similarly, the statement, “The Bank continuously monitors its compliance performance and initiates remedial actions as required” might entail that all risk categories with residual risk higher than ‘low’ will be subject to continuous monitoring and will be addressed by specific action plans, whose extent will vary depending on the severity of the residual risk observed.
3.2.2 Prohibited activities
In addition to the overarching statement, it can be useful for financial institutions to expressly outline prohibited activities where zero-tolerance policy applies (Figure 2).
Table 2:Examples of prohibited activities in risk appetite statements
| 1 – Large European bank“With respect to money-laundering risk, it is prohibited to establish business relationships/carry out transactions with: shell banks or correspondent banks that are known for permitting their accounts to be used by shell banks; anonymous accounts; legal entities whose Ultimate Beneficial Owner cannot be identified; individuals/entities subject to financial sanctions by OFAC, EU, UN; individuals/entities known for being actively involved in criminal activities; money service businesses that allow their customers to do business on behalf of third parties; digital/virtual currency providers and exchange platforms.” |
3.3 RAF Level 2: Risk Appetite metrics
The second level of RAF defines measurable metrics and related tolerance thresholds, each triggering different escalation levels in case of a breach.
3.3.1 Defining appropriate metrics
There are two common approaches for the definition of Level 2 metrics:
Use of operational losses as a comprehensive metric for all non-financial risks.
Use of risk assessment outcomes (for the different non-financial risk types) as an introductory metric that enables deep dives on specific non-financial risks.
Table 3:Example of Level 1 overall statement and related guidance for Level 2 metrics
| Level 1 Risk Appetite Statement | Guidance for Level 2 metrics definition |
| Example 1 “We are committed to maintaining operational losses within a limited range, consistent with our business profile and operations […].” | This statement addresses non-financial risks globally, “capturing” them via operational losses. |
| Example 2 “We are committed to ensuring formal and substantive compliance to all applicable regulations, to avoid sanctions and legal fines […].” | This statement addresses a specific non-financial risk (compliance), allowing further drill downs both at the second and third levels. |
The second approach is more commonly found in leading banks, using residual risk generated from risk assessment as the primary metric. This approach is in line with feedback collected by the ECB and has the following key advantages [9]:
Comprehensiveness, given its ability to capture jointly intrinsic characteristics (inherent risk) and effectiveness of controls in place (controls’ adequacy).
Maturity, thanks to evolution over recent years of risk assessment methodologies, which cover a wide range of non-financial risk areas, as well as the use of advanced measurement methods.
Data Availability, because of the consolidation over-time of reliable and high-quality input sources as well as the possibility of accessing data with sufficient historical depth.
Modularity, thanks to the possibility of breaking down the aggregated metric and focusing on single non-financial risk areas (see also Section 3.4 below).
3.3.2 Metrics: setting the thresholds
In the paragraphs below, we describe the approaches adopted by primary industry players for the setting of thresholds respectively for a Level 2 metric based on operational losses and for another Level 2 metric based on risk assessment.
3.3.2.1 Thresholds based on benchmark and historical internal loss data for a metric based on operational losses
In the case of a Level 2 metric based on operational losses, the identification of relevant thresholds can take into consideration:
Internal data capturing losses registered in past years and connected to a specific non-financial risk type.
Benchmark data relating to comparable peers.
Top management input reflecting preferences and expectations.
Top players often rely on a combination of the above-mentioned input sources, as exemplified below (aggregated example).
Figure 2:Definition of thresholds for a Level 2 metric based on operational losses
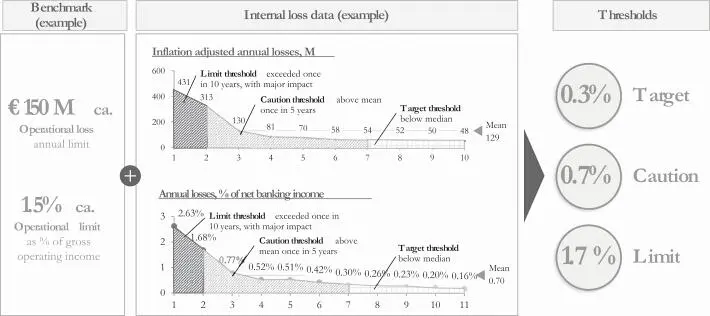
Starting from peers’ tolerance levels for operational losses connected to compliance risks (both as absolute values and as a percentage of gross operating income), the bank in this example then carried out a detailed historical analysis of its own internal losses. As result, thresholds were defined as follows:
Target: set to be below median of distribution.
Caution: set to be above mean and exceeded only once in the past five years.
Limit: set to be above mean and exceeded only once in the past ten years.
The bank in this example allowed for thresholds to be changed by +/- 10% based on managerial judgement.
3.3.2.2 Thresholds based on residual risk levels for a metric based on risk assessment
Among the main advantages of using risk assessment as second level metric, it is possible to provide a holistic overview of a broad set of non-financial risks and to prioritise the riskiest.
Figure 3:Definition of thresholds for a Level 2 metric based on risk assessment
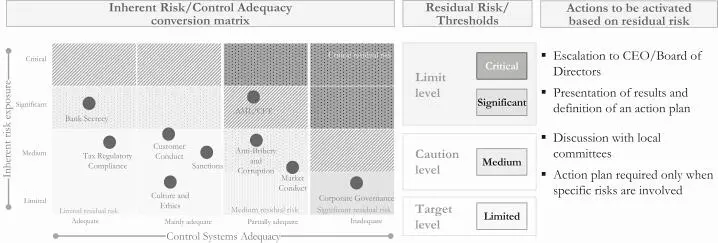
A top-down risk assessment of all non-financial risks will allow the institution to prioritise risk types for which the caution or limit thresholds are exceeded (e.g. in the example above AML/CFT, anti-bribery and corruption have a critical or significant residual risk, above the limit threshold). A bottom-up risk assessment analysis can follow, to identify i) underlying factors that led to a breach of the threshold (e.g. products vs. client geography vs. distribution channel) and ii) the entities or divisions most accountable.
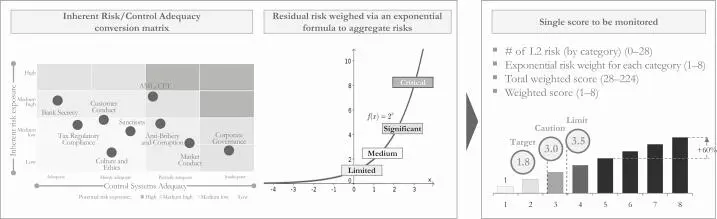
To complement the Level 2 metrics, some players have introduced a synthetic indicator across all non-financial risks. The synthetic metric is calculated by aggregating the different residual risks with a quadratic weighting formula to over-weight elevated risk levels. The same escalation actions described before can be activated on this aggregated metric.
Figure 4:Aggregate Level 2 metric based on risk assessment results
3.4 RAF Level 3: Key Risk Indicators
Level 3 cascades the RAF down to the business lines and entity level via specific Key Risk Indicators (KRIs), which allow for the early detection of potential deviation from risk appetite objectives, facilitating timely intervention.
Читать дальшеИнтервал:
Закладка:
Похожие книги на «Non-financial Risk Management in the Financial Industry»
Представляем Вашему вниманию похожие книги на «Non-financial Risk Management in the Financial Industry» списком для выбора. Мы отобрали схожую по названию и смыслу литературу в надежде предоставить читателям больше вариантов отыскать новые, интересные, ещё непрочитанные произведения.


Обсуждение, отзывы о книге «Non-financial Risk Management in the Financial Industry» и просто собственные мнения читателей. Оставьте ваши комментарии, напишите, что Вы думаете о произведении, его смысле или главных героях. Укажите что конкретно понравилось, а что нет, и почему Вы так считаете.