Tormod Næs - Multiblock Data Fusion in Statistics and Machine Learning
Здесь есть возможность читать онлайн «Tormod Næs - Multiblock Data Fusion in Statistics and Machine Learning» — ознакомительный отрывок электронной книги совершенно бесплатно, а после прочтения отрывка купить полную версию. В некоторых случаях можно слушать аудио, скачать через торрент в формате fb2 и присутствует краткое содержание. Жанр: unrecognised, на английском языке. Описание произведения, (предисловие) а так же отзывы посетителей доступны на портале библиотеки ЛибКат.
- Название:Multiblock Data Fusion in Statistics and Machine Learning
- Автор:
- Жанр:
- Год:неизвестен
- ISBN:нет данных
- Рейтинг книги:3 / 5. Голосов: 1
-
Избранное:Добавить в избранное
- Отзывы:
-
Ваша оценка:
Multiblock Data Fusion in Statistics and Machine Learning: краткое содержание, описание и аннотация
Предлагаем к чтению аннотацию, описание, краткое содержание или предисловие (зависит от того, что написал сам автор книги «Multiblock Data Fusion in Statistics and Machine Learning»). Если вы не нашли необходимую информацию о книге — напишите в комментариях, мы постараемся отыскать её.
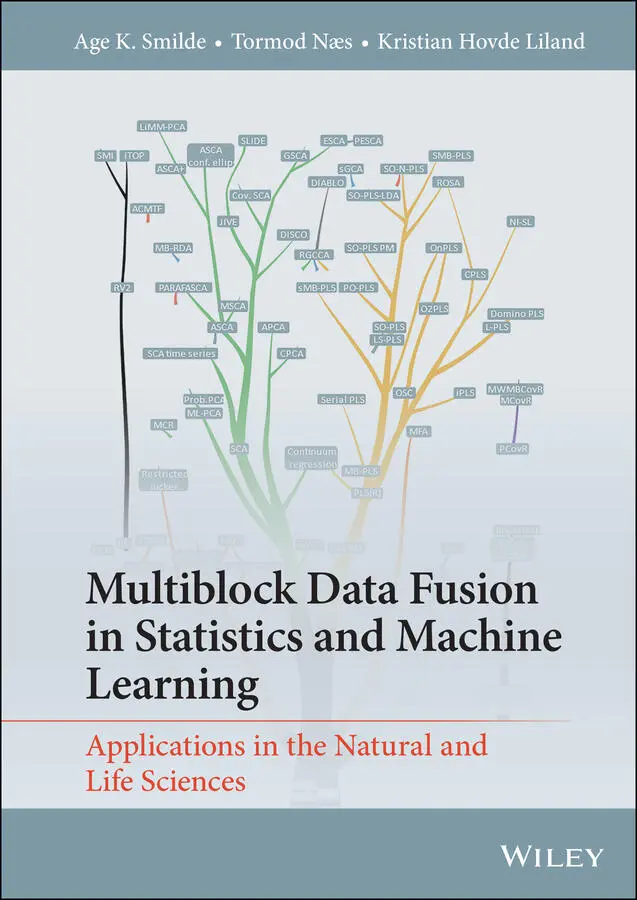
Explore the advantages and shortcomings of various forms of multiblock analysis, and the relationships between them, with this expert guide Multiblock Data Fusion in Statistics and Machine Learning: Applications in the Natural and Life Sciences
Multiblock Data Fusion in Statistics and Machine Learning: Applications in the Natural and Life Sciences
Multiblock Data Fusion in Statistics and Machine Learning — читать онлайн ознакомительный отрывок
Ниже представлен текст книги, разбитый по страницам. Система сохранения места последней прочитанной страницы, позволяет с удобством читать онлайн бесплатно книгу «Multiblock Data Fusion in Statistics and Machine Learning», без необходимости каждый раз заново искать на чём Вы остановились. Поставьте закладку, и сможете в любой момент перейти на страницу, на которой закончили чтение.
Интервал:
Закладка:
3 Chapter 3Figure 3.1 Skeleton of a three-block data...Figure 3.2 Skeleton of a four-block data...Figure 3.3 Skeleton of a three-block data...Figure 3.4 Skeleton of a three-block...Figure 3.5 Skeleton of a four-block...Figure 3.6 Topology of a three-block...Figure 3.7 Topology of a three-block...Figure 3.8 Different arrangements...Figure 3.9 Unsupervised combination...Figure 3.10 Supervised three-set problem...Figure 3.11 Supervised L-shape problem...Figure 3.12 Path model structure...Figure 3.13 Idea of linking two...Figure 3.14 Different linking...Figure 3.15 Idea of linking...Figure 3.16 Different linking...Figure 3.17 Treating common and distinct...
4 Chapter 4Figure 4.1 Explanation of the scale...Figure 4.2 Topology of interactions...Figure 4.3 The RV and partial RV...Figure 4.4 Decision tree for selecting...
5 Chapter 5Figure 5.1 Unsupervised analysis...Figure 5.2 Illustration explaining...Figure 5.3 The idea of common...Figure 5.4 Proportion of explained...Figure 5.5 Row-spaces visualised...Figure 5.6 Difference between weights...Figure 5.7 The logistic function...Figure 5.8 CNA data visualised...Figure 5.9 Score plot of the CNA...Figure 5.10 Plots for selecting...Figure 5.11 Biplots from PCA-GCA...Figure 5.12 Amount of explained...Figure 5.13 Amount of explained...Figure 5.14 Scores (upper part)...Figure 5.17 True design used...Figure 5.15 ACMTF as applied...Figure 5.16 True design used...Figure 5.18 Example of the properties...Figure 5.19 Quantification of modes...Figure 5.20 Linking the blocks...Figure 5.21 Decision tree...Figure 5.22 Decision tree for...
6 Chapter 6Figure 6.1 ASCA decomposition...Figure 6.2 A part of the ASCA...Figure 6.3 The ASCA scores...Figure 6.4 The ASCA scores on the factor...Figure 6.5 The ASCA scores on the interaction...Figure 6.6 PCA on toxicology data...Figure 6.7 ASCA on toxicology data...Figure 6.8 PARAFASCA on toxicology...Figure 6.9 Permutation example...Figure 6.10 Permutation test...Figure 6.11 ASCA candy scores...Figure 6.12 ASCA assessor scores...Figure 6.13 ASCA assessor and candy...Figure 6.14 PE-ASCA of the NMR metabolomics...Figure 6.15 Tree for selecting...
7 Chapter 7Figure 7.1 Conceptual illustration...Figure 7.2 Illustration of link...Figure 7.3 Cross-validated explained...Figure 7.4 Super-weights (w) for the...Figure 7.5 Block-weights (wm) for first...Figure 7.6 Block-scores (tm, for left...Figure 7.7 Classification by regression...Figure 7.8 AUROC values of different...Figure 7.9 Super-scores...Figure 7.10 Linking structure...Figure 7.11 The SO-PLS iterates...Figure 7.20 CV-ANOVA results...Figure 7.13 Måge plot...Figure 7.12 The CVANOVA...Figure 7.14 PCP plots for wine...Figure 7.15 Måge plot showing...Figure 7.16 Block-wise scores...Figure 7.17 Block-wise (projected)...Figure 7.18 Block-wise loadings...Figure 7.19 Måge plot...Figure 7.21 Loadings from Principal...Figure 7.22 RMSEP for fish data...Figure 7.23 Regression coefficients...Figure 7.24 SO-PLS results using...Figure 7.25 Illustration of the idea...Figure 7.26 PO-PLS calibrated/fitted...Figure 7.27 PO-PLS calibrated...Figure 7.28 PO-PLS common scores...Figure 7.29 PO-PLS common...Figure 7.30 PO-PLS distinct loadings...Figure 7.31 ROSA component selection...Figure 7.32 Cross-validated explained...Figure 7.33 ROSA weights...Figure 7.34 Summary of cross-validated...Figure 7.35 The decision paths...
8 Chapter 8Figure 8.1 Figure (a)–(c) represent...Figure 8.2 Conceptual illustration...Figure 8.3 Topologies for four...Figure 8.4 Scheme for information...Figure 8.5 Preference mapping...Figure 8.6 Results from consumer...Figure 8.7 Results from consumer liking...Figure 8.8 Relations between segments...Figure 8.9 Topology for the extension...Figure 8.10 L-block scheme with...Figure 8.11 Endo-L-PLS results...Figure 8.12 Classification...Figure 8.13 (a) Data structure for labelled...Figure 8.14 Tree for selecting methods...
9 Chapter 9Figure 9.1 General setup for fusing heterogeneous...Figure 9.2 Score plots of IDIOMIX...Figure 9.3 True design used in mixture...Figure 9.4 Cross-validation results...Figure 9.5 Explained variances...Figure 9.6 From multiblock data...Figure 9.7 Decision tree for selecting...
10 Chapter 10Figure 10.1 Results from multiblock...Figure 10.2 Pie chart of the sources...Figure 10.3 Flow chart...Figure 10.4 An illustration of...Figure 10.5 Path diagram for a wine...Figure 10.6 Wine data. PCP plots...Figure 10.7 An illustration of the multigroup...Figure 10.8 Decision tree for selecting...
11 Chapter 11Figure 11.1 Output from use of scoreplot...Figure 11.2 Output from use of loadingplot...Figure 11.3 Output from use of scoreplot...Figure 11.4 Output from use of loadingplot...Figure 11.5 Output from use of plot...Figure 11.6 Output from use of scoreplot()...Figure 11.7 Output from use of scoreplot()...Figure 11.8 Output from use of loadingplot()...Figure 11.9 Output from use of scoreplot()...Figure 11.10 Output from use of loadingplot()...Figure 11.11 Output from use of scoreplot()...Figure 11.12 Output from use of maage().Figure 11.13 Output from use of maageSeq().Figure 11.14 Output from use of loadingplot()...Figure 11.15 Output from use of scoreplot()...Figure 11.16 Output from use of scoreplot()...Figure 11.17 Output from use of plot()...Figure 11.18 Output from use of scoreplot()...Figure 11.19 Output from use of loadingplot()...Figure 11.20 Output from use of loadingplot()...Figure 11.21 Output from use of scoreplot()...Figure 11.22 Output from use of image()...Figure 11.23 Output from use of image()...Figure 11.24 Output from use of scoreplot()...Figure 11.25 Output from use of plot()...
List of Tables
1 Chapter 1 Table 1.1 Overview of methods... Table 1.2 Abbreviations of the...
2 Chapter 2 Table 2.1 Formal treatment of types...Table 2.2 Different methods for fusing...Table 2.3 The matrices of which the weights...
3 Chapter 4Table 4.1 Overview of the data sets...
4 Chapter 5Table 5.1 Overview of methods...Table 5.2 Different types of SCA...Table 5.3 Proportions of explained...Table 5.4 Properties of methods...
5 Chapter 6Table 6.1 Overview of methods...
6 Chapter 7Table 7.1 Overview of methods...
7 Chapter 8Table 8.1 Overview of methods...Table 8.2 Tabulation of consumer characteristics...Table 8.3 Consumer liking of cheese...
8 Chapter 9Table 9.1 Overview of methods...
9 Chapter 10Table 10.1 Overview of methods...Table 10.2 Results of the single-block...Table 10.3 Results of the multiway...Table 10.4 SO-PLS-PM results for wine data...
10 Chapter 11Table 11.1 R packages on CRAN having...Table 11.2 MATLAB toolboxes and...Table 11.3 Python packages having...Table 11.4 Commercial software having...
Guide
1 Cover
2 Title page Multiblock Data Fusion in Statistics and Machine Learning Applications in the Natural and Life Sciences Age K. Smilde Swammerdam Institute for Life Sciences, University of Amsterdam, Amsterdam, NL and Simula Metropolitan Center for Digital Engineering, Oslo, NO Tormod Næs Nofima Ås, NO Kristian Hovde Liland Norwegian University of Life Sciences Ås, NO
3 Copyright
4 Table of Contents
5 Foreword
6 Preface
7 List of Figures
8 List of Tables
9 Begin Reading
10 References
11 Index
12 End User License Agreement
Pages
1 i
2 ii
3 iii
4 iv
5 v
6 vi
7 vii
8 viii
9 ix
10 x
11 xi
12 xii
13 xiii
14 xiv
15 xv
16 xvi
17 xvii
18 xviii
19 xix
20 xx
21 xxi
22 xxii
23 xxiii
24 xxiv
25 xxv
26 xxvi
27 xxvii
28 xxviii
29 xxix
30 xxx
31 xxxi
32 xxxii
33 xxxiii
34 xxxiv
35 1
36 2
37 3
38 4
Читать дальшеИнтервал:
Закладка:
Похожие книги на «Multiblock Data Fusion in Statistics and Machine Learning»
Представляем Вашему вниманию похожие книги на «Multiblock Data Fusion in Statistics and Machine Learning» списком для выбора. Мы отобрали схожую по названию и смыслу литературу в надежде предоставить читателям больше вариантов отыскать новые, интересные, ещё непрочитанные произведения.


Обсуждение, отзывы о книге «Multiblock Data Fusion in Statistics and Machine Learning» и просто собственные мнения читателей. Оставьте ваши комментарии, напишите, что Вы думаете о произведении, его смысле или главных героях. Укажите что конкретно понравилось, а что нет, и почему Вы так считаете.