Tormod Næs - Multiblock Data Fusion in Statistics and Machine Learning
Здесь есть возможность читать онлайн «Tormod Næs - Multiblock Data Fusion in Statistics and Machine Learning» — ознакомительный отрывок электронной книги совершенно бесплатно, а после прочтения отрывка купить полную версию. В некоторых случаях можно слушать аудио, скачать через торрент в формате fb2 и присутствует краткое содержание. Жанр: unrecognised, на английском языке. Описание произведения, (предисловие) а так же отзывы посетителей доступны на портале библиотеки ЛибКат.
- Название:Multiblock Data Fusion in Statistics and Machine Learning
- Автор:
- Жанр:
- Год:неизвестен
- ISBN:нет данных
- Рейтинг книги:3 / 5. Голосов: 1
-
Избранное:Добавить в избранное
- Отзывы:
-
Ваша оценка:
Multiblock Data Fusion in Statistics and Machine Learning: краткое содержание, описание и аннотация
Предлагаем к чтению аннотацию, описание, краткое содержание или предисловие (зависит от того, что написал сам автор книги «Multiblock Data Fusion in Statistics and Machine Learning»). Если вы не нашли необходимую информацию о книге — напишите в комментариях, мы постараемся отыскать её.
Explore the advantages and shortcomings of various forms of multiblock analysis, and the relationships between them, with this expert guide Multiblock Data Fusion in Statistics and Machine Learning: Applications in the Natural and Life Sciences
Multiblock Data Fusion in Statistics and Machine Learning: Applications in the Natural and Life Sciences
Multiblock Data Fusion in Statistics and Machine Learning — читать онлайн ознакомительный отрывок
Ниже представлен текст книги, разбитый по страницам. Система сохранения места последней прочитанной страницы, позволяет с удобством читать онлайн бесплатно книгу «Multiblock Data Fusion in Statistics and Machine Learning», без необходимости каждый раз заново искать на чём Вы остановились. Поставьте закладку, и сможете в любой момент перейти на страницу, на которой закончили чтение.
Интервал:
Закладка:
An intriguing new development in systems biology is to involve microbiome measurements of the biological system (Franzosa et al ., 2015). This has sparked many studies in different areas of medicine, such as inflammatory bowel disease (Huang et al ., 2014) and cancer (Weir et al ., 2013). It is also highly relevant for nutritional and food studies (Jacobs et al ., 2009; Van Duynhoven et al ., 2010; Moco et al ., 2012). In all these cases, the microbiome data are combined with other omics data generating multiblock data analysis problems.
1.4.4 Chemistry
Multiblock data analysis problems arise in different parts of chemistry. A very active area is analytical chemistry, with two very prominent topics. The first one is multivariate curve resolution where the general idea is to mathematically resolve chemical mixtures in underlying pure chemical components and their concentration profiles (Tauler et al ., 1995; de Juan and Tauler, 2006). Many different types of multiblock data analyses are performed in this area with a special emphasis on applying domain-specific constraints. The second application area is calibration where the purpose is to obtain concentrations from instrumental analysis methods. Also in this area multiblock data analysis methods are used (Næs et al ., 2013). A spectroscopy example is given in Example 1.3.
ELABORATION 1.6
Terms in chemistry
Multivariate curve resolution:Part of chemometrics that tries to mathematically resolve mixtures of chemicals into their individual compounds.Multivariate calibration:Part of chemometrics that deals with predicting properties (e.g., concentrations) from spectroscopic measurement. The idea is to replace a slow, expensive measurement technique (the reference method) by a fast, cheaper, and often non-destructive one (a spectroscopic measurement).Process chemometrics:Part of chemometrics devoted to processes; such as process analysis, multivariate process control and process monitoring.Vibrational spectroscopy:Chemical measurement techniques that probe vibrational energies of molecules. There are different types of vibrational spectroscopy: infrared (IR), mid-infrared (MIR), near-infrared (NIR), ultraviolet (UV), visible (VIS) and Raman spectroscopy.
Another area in chemistry which is populated with multiblock data analysis problems is process chemometrics (MacGregor et al ., 1994; Wise and Gallagher, 1996; Kourti et al ., 1995; Lopes et al ., 2002). The general problem is how to combine multiple chemical process measurements for process understanding and statistical process monitoring.
Example 1.3: Chemistry example: Raman spectroscopy data
The data set was first published in a study containing both Raman and near infrared spectroscopy measurements of emulsions (Afseth et al ., 2005). For the Raman data, 1096 Raman shifts, from 1770 cm −1 to 675 cm −1, were recorded for 69 emulsions containing a mixture of proteins, water, and fats (see Figure 1.6). Two reference values are used as responses: polyunsaturated fatty acids (PUFA) as percentage of total sample weight (0.3–11.5%) and as percentage of fats in sample (2.2–61.6%). The reference values have a correlation of R=0.73, i.e. R2=0.54, meaning that around half of the variation in PUFA content is due to the variation in total fat content. The aim of the original study was to be able to quantify the PUFA percentages using only spectroscopy to enable quick, cheap, and non-destructive measurements.
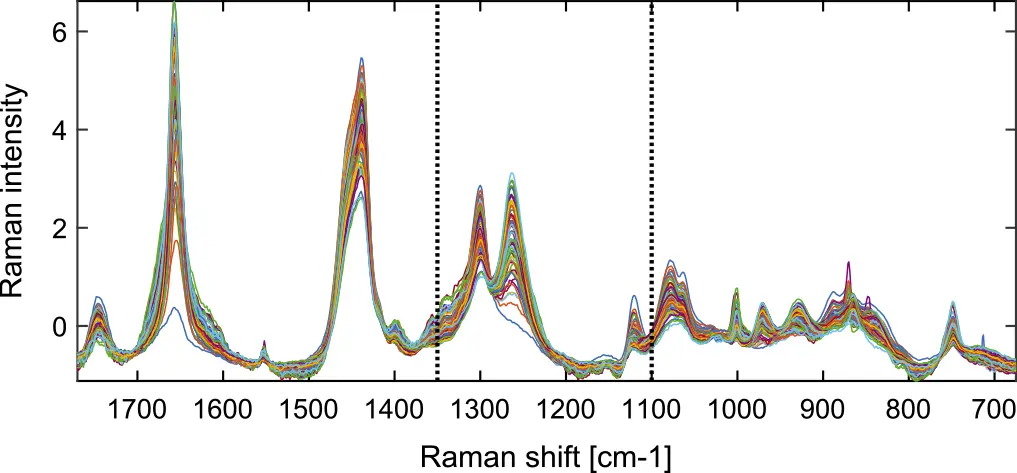
Figure 1.6 Plot of the Raman spectra used in predicting the fat content. The dashed lines show the split of the data set into multiple blocks.
In this book, we will concentrate on the Raman block as this dominated completely in a previous multiblock data analysis study (Liland et al ., 2016), and rather split it into suitable wavelength regions, here splitting at 1350 cm −1 and 1100 cm −1. This is done to explore the predictive power of the different wavelength regions. This data set will be analysed using several of the supervised methods in this book to see what is emphasised by each of them. In general, we see that the predictive models mostly leverage the variables corresponding to molecular vibrations associated with lipids and degrees of saturation, and that these models can reproduce the reference values with high precision.
1.4.5 Sensory Science
Sensory and consumer science is an important discipline in the assessment of food quality. It consists of a large number of measurement methods for determining the descriptive properties of products as well as the consumer liking of the same products (Lawless and Heymann, 2010). Often a product will be characterised by a number of different data types, ranging from classical descriptive sensory analysis using predefined attributes and a trained sensory panel to consumer based characterisation based on, for instance, the check-all-that-apply (CATA) method (Varela and Ares, 2012). The data sets will generally consist of a substantial number of attributes and a relatively moderate number of samples. Of special interest is estimating relations between data blocks related to liking and product characterisation. A large number of methods have been developed for this purpose as will be discussed in Chapters 7, 8and 10in this book (see Næs et al . (2010) for an overview). An example of a typical data structure and its related questions in sensory science is given in Example 1.4.
ELABORATION 1.7
Terms in sensory analysis
Consumer liking:For hedonic sensory methods, a consumer panel is used. The consumer can be asked about how much they like the different products and how willing they are to buy the products tested.Sensory panel:For assessing product quality, it is common to use a sensory panel consisting of a number of trained assessors which assess the intensity on a predefined scale of a number of relevant sensory attributes.Sensory attribute:The measurements, as performed by the sensory panel, such as sweetness, hardness, and acidity (depending on types of products).Rapid sensory methods:There exist a number of so-called rapid sensory methods, for instance, projective mapping, sorting, and CATA. For the latter all participants are asked to tick, for each product, on the relevant attributes on a predefined list. This gives a table of 0s and 1s for each participant.
Example 1.4: Sensory example: consumer liking
A typical multiblock data structure that occurs in consumer science is depicted in Figure 1.7. The context is typically product development where interest is in understanding the relations between descriptive information of a number of prototype samples and the consumer liking of the same samples. In addition, interest is in interpreting the liking patterns in terms of consumer characteristics for better understanding of which consumer groups prefer which products (see e.g., Næs et al . (2018)). Based on this type of information, the product developer can more easily design products that better fit the consumer needs and liking patterns. As can be seen from the figure, both chemical attributes as well as sensory properties/attributes, obtained by a trained sensory panel, can be of interest for describing the products. A number of different liking scores can also be of interest, for instance related to taste and texture (Menichelli et al ., 2013), as depicted by the stack of data blocks for liking. Analysing this so-called L-shape data structure sheds light on, for instance, which are the sensory drivers of liking, which samples are the most liked, what characterises these samples, and what characterises the different consumer groups with different preference patterns.
Читать дальшеИнтервал:
Закладка:
Похожие книги на «Multiblock Data Fusion in Statistics and Machine Learning»
Представляем Вашему вниманию похожие книги на «Multiblock Data Fusion in Statistics and Machine Learning» списком для выбора. Мы отобрали схожую по названию и смыслу литературу в надежде предоставить читателям больше вариантов отыскать новые, интересные, ещё непрочитанные произведения.


Обсуждение, отзывы о книге «Multiblock Data Fusion in Statistics and Machine Learning» и просто собственные мнения читателей. Оставьте ваши комментарии, напишите, что Вы думаете о произведении, его смысле или главных героях. Укажите что конкретно понравилось, а что нет, и почему Вы так считаете.