Handbook on Intelligent Healthcare Analytics
Здесь есть возможность читать онлайн «Handbook on Intelligent Healthcare Analytics» — ознакомительный отрывок электронной книги совершенно бесплатно, а после прочтения отрывка купить полную версию. В некоторых случаях можно слушать аудио, скачать через торрент в формате fb2 и присутствует краткое содержание. Жанр: unrecognised, на английском языке. Описание произведения, (предисловие) а так же отзывы посетителей доступны на портале библиотеки ЛибКат.
- Название:Handbook on Intelligent Healthcare Analytics
- Автор:
- Жанр:
- Год:неизвестен
- ISBN:нет данных
- Рейтинг книги:4 / 5. Голосов: 1
-
Избранное:Добавить в избранное
- Отзывы:
-
Ваша оценка:
Handbook on Intelligent Healthcare Analytics: краткое содержание, описание и аннотация
Предлагаем к чтению аннотацию, описание, краткое содержание или предисловие (зависит от того, что написал сам автор книги «Handbook on Intelligent Healthcare Analytics»). Если вы не нашли необходимую информацию о книге — напишите в комментариях, мы постараемся отыскать её.
The book explores the various recent tools and techniques used for deriving knowledge from healthcare data analytics for researchers and practitioners. A Handbook on Intelligent Healthcare Analytics
Handbook on Intelligent Healthcare Analytics — читать онлайн ознакомительный отрывок
Ниже представлен текст книги, разбитый по страницам. Система сохранения места последней прочитанной страницы, позволяет с удобством читать онлайн бесплатно книгу «Handbook on Intelligent Healthcare Analytics», без необходимости каждый раз заново искать на чём Вы остановились. Поставьте закладку, и сможете в любой момент перейти на страницу, на которой закончили чтение.
Интервал:
Закладка:
2.4 Results and Discussion
From the observations on each state moves, the probability with the power of the matrix is generated. Let us consider the steps as state-to-state transition.
Let A and B be the two states with K steps, which have many possibilities to initialize the time with constant value. When the iterations started from one to the i-th iteration, there will be the same number of vector probability ratio that are identified with three states such as natural disasters ( Figure 2.4), dry, and drought. Figure 2.3shows the variations of number of disasters.
Table 2.2defines the dataset year-wise and its ratio when it is trained according to the NN. In addition, testing data with rating as well reported on a year basis are monitored from the parameters that match according to the testing and training accuracy.
Figure 2.4shows the entities that are identified from the united states of America on various years that have the impact according to the climate changes. Prediction using this dataset based on the developed feature analysis can be performed. Each and every disaster along with the disasters reported year-wise with the count is also reported.
Natural disaster according to the disaster effects and probability of occurrence using stochastic matrix is described in the analysis. Figure 2.5illustrates the understanding of probability ratio. It clearly indicates the year-wise analysis of the disaster along with the economic damage that is caused by these damages. Figure 2.6shows the boxplot view of natural disasters on various entities.
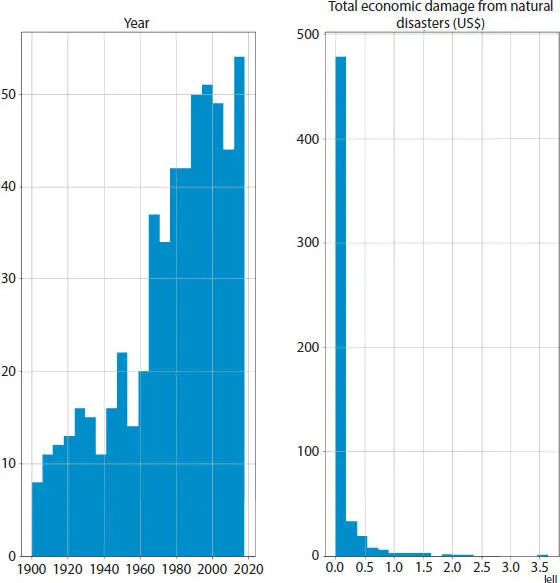
Figure 2.3 Total number of disaster analysis using improved Bayesian Markov chain model.
2.5 Conclusion
As observed from the Markov chain model that is developed, a framework for identifying random effects can create a disaster. Kaggle datasets are used to find the state transition matrix and occurrence that are predicting the natural changes in climate. Computation on the basis of frequency and the latent state changes are monitored based on the probability. By considering the likelihood from the part of observation that are identified from the matrix according to rows and column for assumption. Using the sequence numbering and entries on hidden state, the current sequence follows the Markov model and fixes the likelihood. Using the proposed framework, the tasks such as important performance based on weather forecast are achieved. The proposed algorithm IBHMF that produced a better performance and also independent variables that are factors of time series shows the exact transition matrix analysis to predict the forecast based on climatic change.
Table 2.2 Sample dataset for predicting weather forecasting.
| Year | Total economic damage from natural disasters (US$) | |
| count | 561.000000 | 5.610000e+02 |
| mean | 1977.217469 | 1.146966e+10 |
| std | 30.399233 | 3.199525e+10 |
| min | 1900.000000 | 0.000000e+00 |
| 25% | 1959.000000 | 6.50000e+07 |
| 50% | 1984.000000 | 8.400000e+07 |
| 75% | 2001.000000 | 5.444777e+09 |
| max | 2018.000000 | 3.640932e+11 |
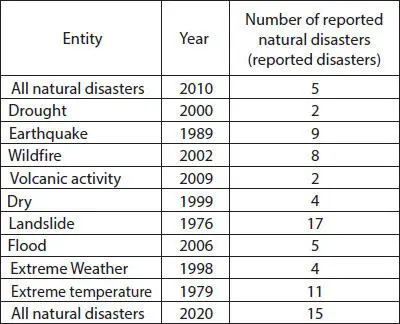
Figure 2.4 Changes from various impacts from natural disaster.
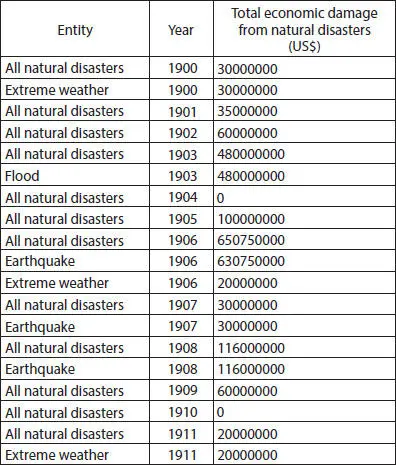
Figure 2.5 Economic damage changes a prediction analysis.
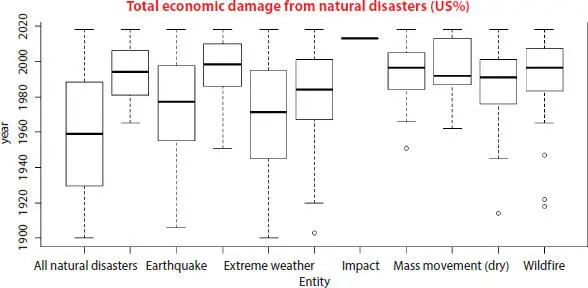
Figure 2.6 Boxplot view of natural disaster on various entity.
References
1. Baboo, S.S., Baboo, S.S., Shereef, I.K., An Efficient Weather Forecasting System Using Artificial Neural Network. Int. J. Environ. Sci. Dev ., 1, 321–326, 2010, https://doi.org/10.7763/ijesd.2010.v1.63.
2. Cognitive Tasks and Learning , n.d. SpringerReference, https://doi.org/10.1007/springerreference_226188.
3. Li, D. and Yu, D., Deep Learning: Methods and Applications. Found. Trends Signal Process ., 7, 3–4, 197–387, 2014.
4. Grinsted, A., Ditlevsen, P., Christensen, J.H., Normalized US Hurricane Damage Estimates Using Area of Total Destruction. Proceedings of the National Academy of Sciences of the United States of America , vol. 116, pp. 23942–46, 20191900-2018.
5. Anand, J. et al ., Efficient Security for Desktop Data Grid using Fault Resilient Content Distribution. Int. J. Eng. Res. Ind. Appl ., 2, 7, 301–313, 20092009.
6. Anand, J. et al ., Efficient Data Storage in Desktop Data-Grid Computing using Real-Time Parameters. Int. J. Comput. Sci. Technol ., 2, 3, 392–397, 2011.
7. Kuswanto, and Kuswanto, Bayesian Model Averaging with Markov Chain Monte Carlo for Calibrating Temperature Forecast from Combination of Time Series Models. J. Math. Stat ., 9, 349–356, 2013, https://doi.org/10.3844/jmssp.2013.349.356.
8. Minsley, B.J., A Trans-Dimensional Bayesian Markov Chain Monte Carlo Algorithm for Model Assessment Using Frequency-Domain Electromagnetic Data. Geophys. J. Int ., 187, 252–272 2011, https://doi.org/10.1111/j.1365-246x.2011.05165.x.
9. Padli, J., Habibullah, M.S., Baharom, A.H., The Impact of Human Development on Natural Disaster Fatalities and Damage: Panel Data Evidence. Econ. Res.-Ekon. Istraž ., 7, 1–17, 2018, https://doi.org/10.1080/1331677x.2018.1504689.
10. Pouyanfar, S., Sadiq, S., Yan, Y., Tian, H., Tao, Y., Reyes, M.P., Shyu, M.-L., Chen, S.-C., Iyengar, S.S., A Survey on Deep Learning. ACM Comput. Surv ., 22, 1–23, 2019, https://doi.org/10.1145/3234150.
11. R. Stuart, J., Stuart, J.R., Norvig, P., Davis, E., Artificial Intelligence: A Modern Approach , Prentice Hall, Springer, New Jersey, 2010.
12. Vista, A., Awwal, N., Care, E., Sequential Actions as Markers of Behavioural and Cognitive Processes: Extracting Empirical Pathways from Data Streams of Complex Tasks. Comput. Educ ., 92–93, 15–36, 2016, https://doi.org/10.1016/j.compedu.2015.10.009.
13. Wollsen, M.G. and Jørgensen, B.N., Improved Local Weather Forecasts Using Artificial Neural Networks. Distributed Computing and Artificial Intelligence, 12th International Conference , 2015, https://doi.org/10.1007/978-3-319-19638-1_9.
14. On Sequential Spectral Analysis of Amplitude-Modulated Time Series, in: Sequential Analysis .
15. Habermann, A.N., Engineering Large Knowledge-Based Systems. Data Knowl. Eng ., 15, 105–117, 1990, https://doi.org/10.1016/0169-023x(90)90007-z.
16. Kellett, J.M., Winstanley, G., Boardman, J.T., A Methodology for Knowledge Engineering Using an Interactive Graphical Tool for Knowledge Modelling. Artif. Intell. Eng ., 4, 92–102, 1989, https://doi.org/10.1016/0954-1810(89)90004-6.
Читать дальшеИнтервал:
Закладка:
Похожие книги на «Handbook on Intelligent Healthcare Analytics»
Представляем Вашему вниманию похожие книги на «Handbook on Intelligent Healthcare Analytics» списком для выбора. Мы отобрали схожую по названию и смыслу литературу в надежде предоставить читателям больше вариантов отыскать новые, интересные, ещё непрочитанные произведения.


Обсуждение, отзывы о книге «Handbook on Intelligent Healthcare Analytics» и просто собственные мнения читателей. Оставьте ваши комментарии, напишите, что Вы думаете о произведении, его смысле или главных героях. Укажите что конкретно понравилось, а что нет, и почему Вы так считаете.