Poly(lactic acid)
Здесь есть возможность читать онлайн «Poly(lactic acid)» — ознакомительный отрывок электронной книги совершенно бесплатно, а после прочтения отрывка купить полную версию. В некоторых случаях можно слушать аудио, скачать через торрент в формате fb2 и присутствует краткое содержание. Жанр: unrecognised, на английском языке. Описание произведения, (предисловие) а так же отзывы посетителей доступны на портале библиотеки ЛибКат.
- Название:Poly(lactic acid)
- Автор:
- Жанр:
- Год:неизвестен
- ISBN:нет данных
- Рейтинг книги:5 / 5. Голосов: 1
-
Избранное:Добавить в избранное
- Отзывы:
-
Ваша оценка:
Poly(lactic acid): краткое содержание, описание и аннотация
Предлагаем к чтению аннотацию, описание, краткое содержание или предисловие (зависит от того, что написал сам автор книги «Poly(lactic acid)»). Если вы не нашли необходимую информацию о книге — напишите в комментариях, мы постараемся отыскать её.
Poly(lactic acid) Synthesis, Structures, Properties, Processing, Applications, and End of Life
Poly(lactic acid) Synthesis, Structures, Properties, Processing, Applications, and End of Life, Second Edition
Poly(lactic acid) — читать онлайн ознакомительный отрывок
Ниже представлен текст книги, разбитый по страницам. Система сохранения места последней прочитанной страницы, позволяет с удобством читать онлайн бесплатно книгу «Poly(lactic acid)», без необходимости каждый раз заново искать на чём Вы остановились. Поставьте закладку, и сможете в любой момент перейти на страницу, на которой закончили чтение.
Интервал:
Закладка:
Figure 6.18shows the typical 2D‐WAXD patterns of stereocomplex with different enantiomer ratios. The unit cell parameters are almost common to these stereocomplexes; a = b = 14.94 Å, c (chain axis) = 8.624 Å, α = β = 90° and γ = 120°. Although the R 3 c model is not necessarily reasonable in such a point that only R : L = 1 : 1 ratio is accepted, the X‐ray equatorial line profile reproduces the observed data quite well, while the layer line profiles are not very well reproduced. In the case of the  model, the upward and downward chains of the same handedness are located at 50% at one lattice site. The oppositely‐handed chains are positioned at the neighboring sites. As a result, this model gives the R : L = 1 : 1 ratio only. The
  model did not reproduce the observed diffraction profiles very well, which can be deleted here from the preferential candidates. A new possible model of P 3 space group was proposed by Tashiro et al., which can cover the stereocomplex produced in the range of L/D 7/3–4/6 [46, 47]. In the P 3 model, the packing mode of the chains is similar to those of the above‐mentioned two models. But, the two neighboring sites are symmetrically independent. This means that the pair of the neighboring sites (left and right sides) can be (R and R), (R and L) or (L and L) at an arbitrary ratio. However, the packing structure must be stereochemically reasonable. As mentioned above, the R 3 c model can reproduce the X‐ray equatorial line profile well, suggesting the projected structure of R and L chains should be the same as that predicted for the R 3 c model (see Figure 6.16a). It is noticed that the right‐handed upward (Ru) chain and the left‐handed downward (Ld) chain show the same projected structure perfectly ( Figure 6.16c). The Lu and Rd chains are also in the same situation. Then, the plausible pair of the two neighboring sites is (Ru/Ld and Lu/Rd, case 3) or (Ru/Ld and Ru/Ld, case 4), as illustrated in Figure 6.16c. Finally, the model of case 3 was found as the best candidate to reproduce the observed X‐ray diffraction data. The crystal structure is shown in Figure 6.19. Different from the case of the R 3 c model, the P 3 model gives better agreement for all the layer‐line profiles up to the higher angle regions as seen in Figure 6.20a. Besides, as already mentioned, the R and L chains can be located at one site with various ratios, satisfying well the experimental data shown in Figure 6.20.
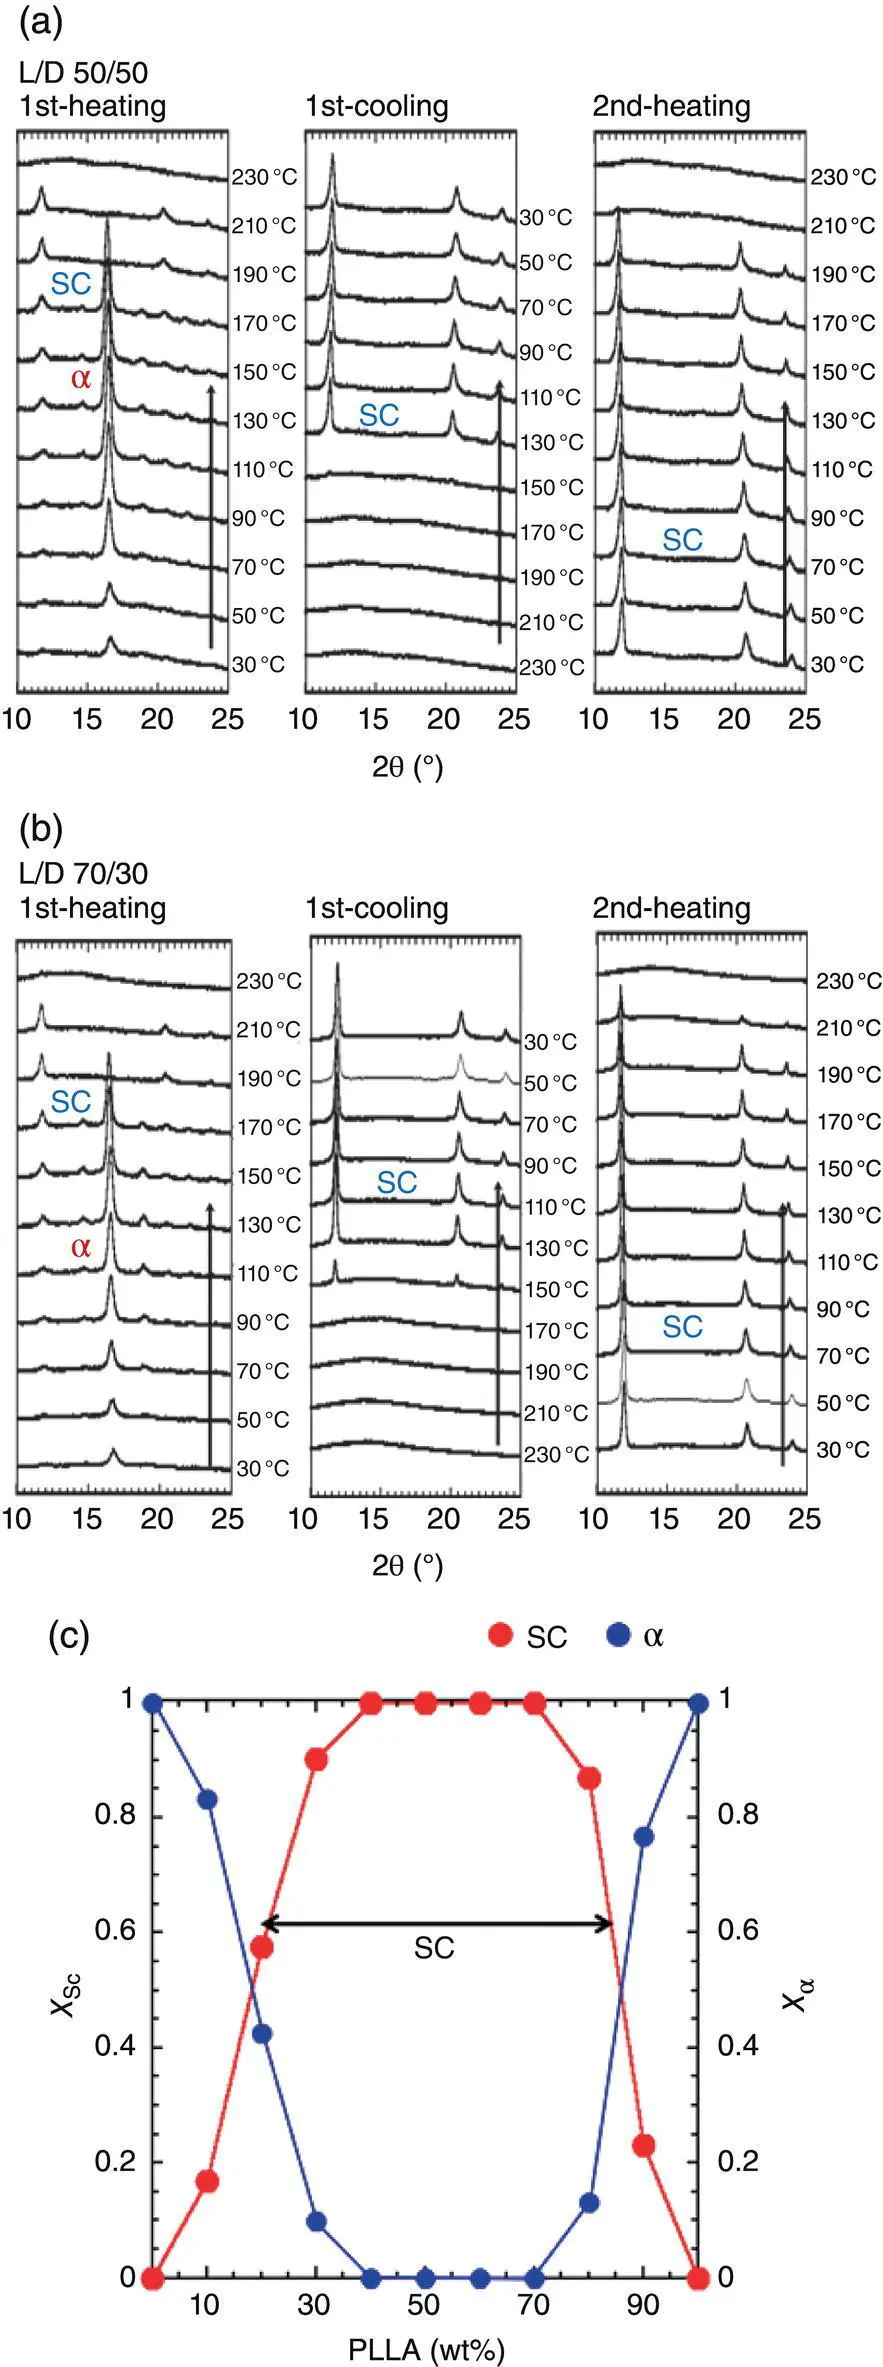
FIGURE 6.17 Temperature dependence of X‐ray diffraction profiles of the solution‐cast films, (a) PLLA/PDLA 50/50 and (b) PLLA/PDLA 70/30 sample measured in the heating, cooling, and reheating processes. (c) The relative content of the αform and SC phase measured for the PLLA/PDLA blend samples with the various L/D contents on the basis of the X‐ray diffraction data measured after cooling from the melt.
Source: Reproduced from Tashiro et al., Macromolecules 2017, 50, 8048−8065.
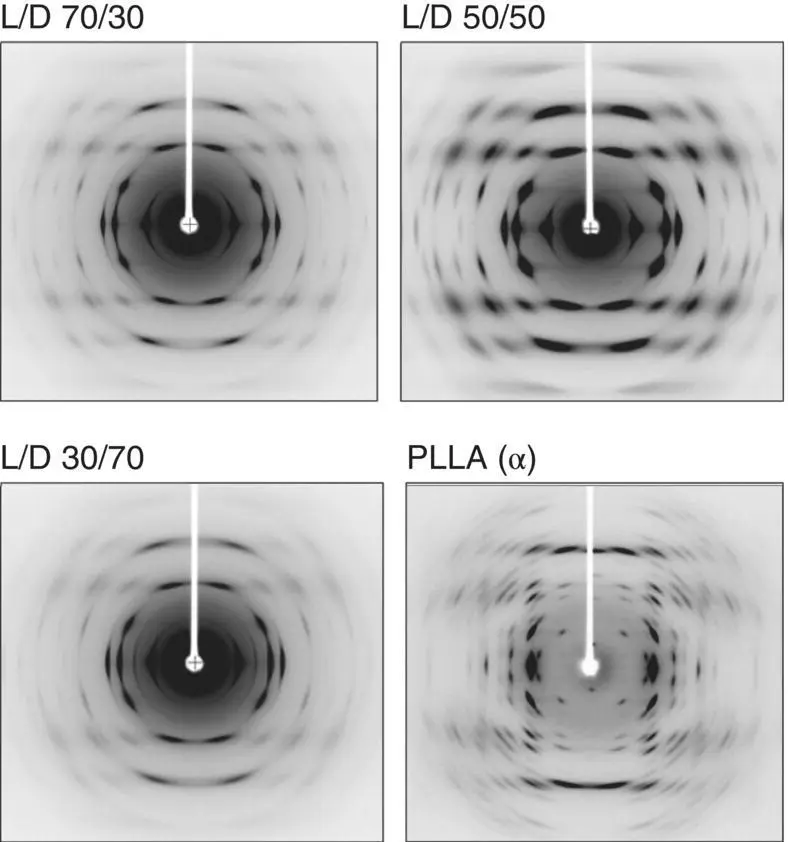
FIGURE 6.18 2‐Dimensional X‐ray diffraction diagrams of the uniaxially oriented SC phase of the PLLA/PDLA blend samples with the various L/D ratios. The diffraction diagram of the uniaxially oriented PLLA αform is shown here also for comparison.
Source: Reproduced from Tashiro et al., Macromolecules 2017, 50, 8048−8065.
6.5.2 Experimental Support of P 3 Structure Model
The P 3 structural model is consistent with the various experimental data. The details are discussed in the original paper [46, 47]. Several representative points are listed below:
1 According to the International Tables for Crystallography [53], the (000l) diffractions are expected to appear for l = 6, 12, … in the case of the R3c model. But no such extinction rule is predicted for the P3 model. As seen in the actually measured Weissenberg pattern shown in Figure 6.20b, the 0003 diffraction was clearly observed in addition to 0006, 00012 peaks. The R3c model cannot satisfy this result.
2 Once the stereocomplex is formed, it does not transform to the α form anymore even after many repetitions of melting and slow cooling ( Figure 6.17). The L or D chains are supposed to be trapped into the stereocomplex region without a remarkable change of the spatial arrangements. FIGURE 6.19 Crystal structure of PLLA (L)/PDLA (R) stereocomplex. One lattice site is statistically occupied by a pair of Rd and Lu chains and the neighboring site by a pair of Ru and Ld chains: (a) along the c‐axis and (b) along the 110 plane.Source: Reproduced from Tashiro et al., Macromolecules 2017, 50, 8048−8065.
3 The experimental data including the formation of the spherulites and the single crystal of the stereocomplex and the SAXS data analysis [77, 78] are interpreted by assuming the existence of the stacked lamellar structure with the upward and downward chain stems (or the folded chain structure). The R3c model is difficult to apply for the interpretation of these experimental data.
4 Another important experimental evidence to show the reasonableness of the P3 model comes from the vibrational circular dichroism (VCD) data. The VCD is one powerful technique to distinguish the R and L chains in the crystal lattice. The right‐handed and left‐handed rotating IR beams (r‐ and l‐circularly‐polarized beams, respectively) are incident to the sample. The l‐polarized IR beam is absorbed by the L chains and the r‐polarized IR beam by the R chains. The absorbance difference, ΔAbs(ν) = Abs L(ν) −Abs R(ν), is 0 if the L and D species are in the equal amounts in the sample, but it changes with other L/D blend ratios. Since the IR bands of the crystalline and amorphous phases can be distinguished easily, the measurement of ΔAbs for the crystalline bands can be used to study the R3c and P3 models. For the R3c model, the ΔAbs of the crystalline bands should be always 0 even when the L/D ratio is changed, while the ΔAbs may change depending on the R/L ratio for the P3 model.
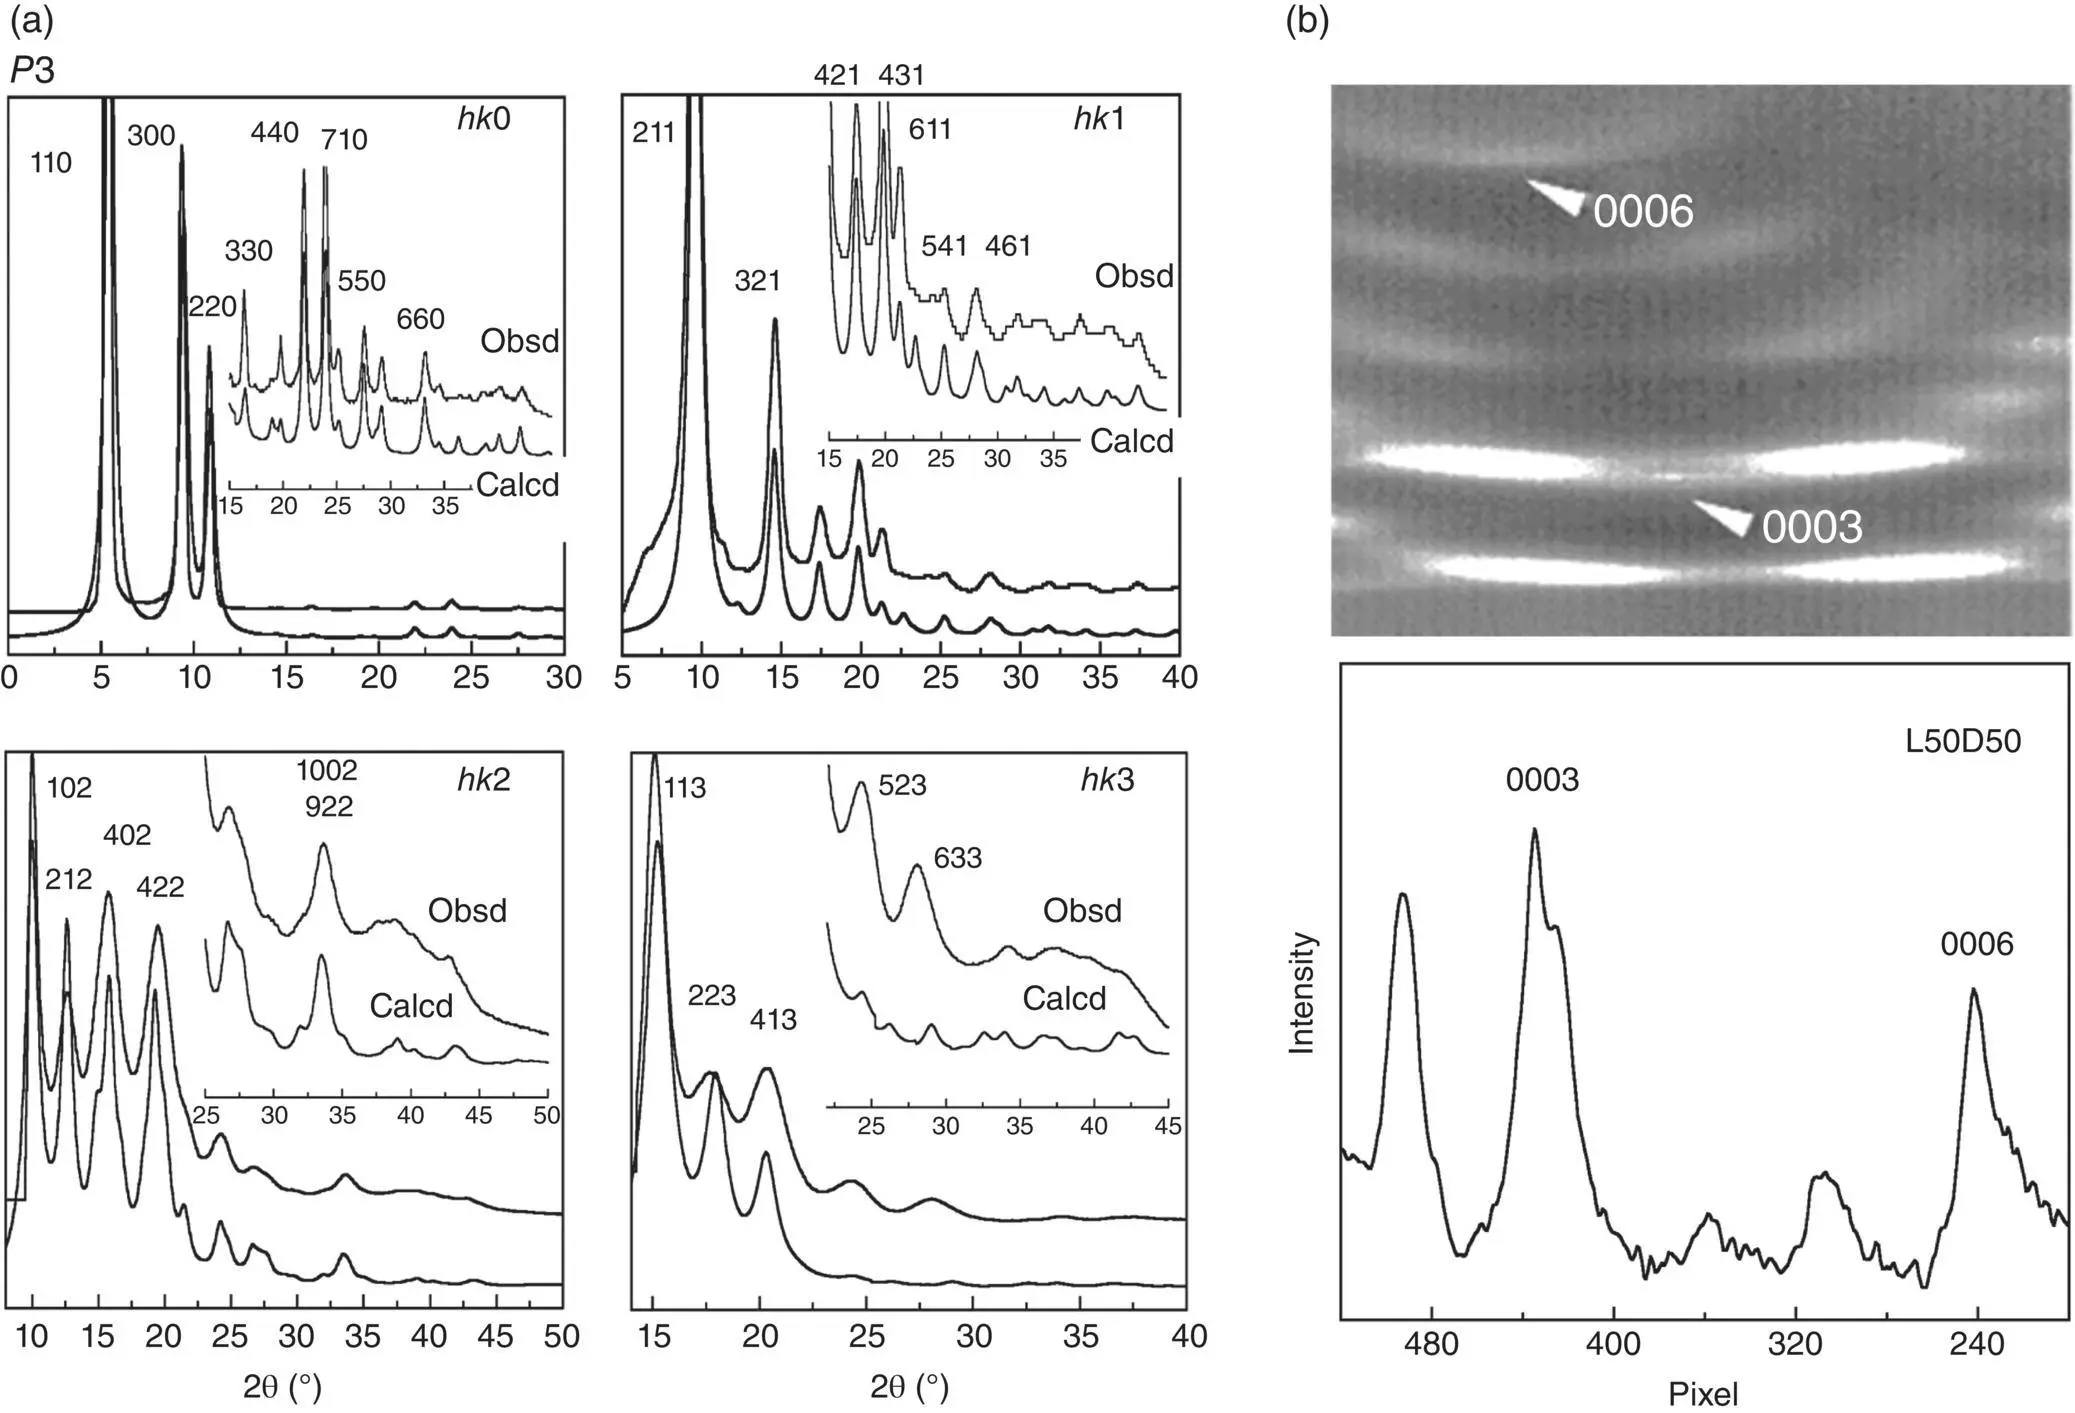
FIGURE 6.20 (a) Comparison of the observed X‐ray diffraction profiles along the various layer lines with those calculated for the L/D 50/50 stereocomplex model of the P 3 space group symmetry. An incident X‐ray is the Mo‐K αline. (b) The Weissenberg 000 l diffraction pattern measured for the L/D 50/50 stereocomplex. The diffraction profile was obtained by scanning the 2D pattern along the line of 000 l .
Source: Reproduced from Tashiro et al., Macromolecules 2017, 50, 8048−8065.
Figure 6.21a shows the experimental results collected for the PLLA (L)/PDLA (R) blend samples cast from chloroform solutions. The thus‐prepared films are almost in the amorphous state. In the normal (not‐circularly‐polarized) IR spectra, the typical amorphous band is detected at about 1300 cm −1, the absorbance of which does not change at all as long as the sample thickness is the same, because the L and R chains cannot be distinguished. But, the situation changes remarkably in the VCD spectra. Depending on the L/R content the Δ Abs changes between plus and minus values systematically. Figure 6.21a indicates that the L and R chains in the amorphous region are mixed homogeneously. Our attention should be drawn to the behavior of the crystallization‐sensitive bands of the stereocomplex. In the normal IR spectra, the heat treatment caused a reduction of the amorphous band intensity (broken line) and a remarkable increase of the 1306 cm −1band, which is assigned to the crystalline stereocomplex phase ( Figure 6.21b). In the VCD spectra, Δ Abs ( ν ) of 1306 cm −1band changes systematically and quite clearly depending on the L/D ratio. This observation indicates that the L and R chains in the crystalline region of the stereocomplex changes their relative content systematically depending on the L/D blend ratio, being consistent with the X‐ray observation. In this way, it is reasonable to conclude that the L and R chain stems co‐crystallize in the same crystallite of the stereocomplex at various L/R contents in the region of 70/30 ≤ L/R < 40/60.
Читать дальшеИнтервал:
Закладка:
Похожие книги на «Poly(lactic acid)»
Представляем Вашему вниманию похожие книги на «Poly(lactic acid)» списком для выбора. Мы отобрали схожую по названию и смыслу литературу в надежде предоставить читателям больше вариантов отыскать новые, интересные, ещё непрочитанные произведения.


Обсуждение, отзывы о книге «Poly(lactic acid)» и просто собственные мнения читателей. Оставьте ваши комментарии, напишите, что Вы думаете о произведении, его смысле или главных героях. Укажите что конкретно понравилось, а что нет, и почему Вы так считаете.