Nathaniel Tkacz - Being with Data
Здесь есть возможность читать онлайн «Nathaniel Tkacz - Being with Data» — ознакомительный отрывок электронной книги совершенно бесплатно, а после прочтения отрывка купить полную версию. В некоторых случаях можно слушать аудио, скачать через торрент в формате fb2 и присутствует краткое содержание. Жанр: unrecognised, на английском языке. Описание произведения, (предисловие) а так же отзывы посетителей доступны на портале библиотеки ЛибКат.
- Название:Being with Data
- Автор:
- Жанр:
- Год:неизвестен
- ISBN:нет данных
- Рейтинг книги:3 / 5. Голосов: 1
-
Избранное:Добавить в избранное
- Отзывы:
-
Ваша оценка:
Being with Data: краткое содержание, описание и аннотация
Предлагаем к чтению аннотацию, описание, краткое содержание или предисловие (зависит от того, что написал сам автор книги «Being with Data»). Если вы не нашли необходимую информацию о книге — напишите в комментариях, мы постараемся отыскать её.
Beginning with a simple question – how do most people encounter and experience data? – Nathaniel Tkacz sets out on a path at odds with much of the contemporary discussion about data. When we encounter data, he contends, it is often in highly routinised ways, through formatted displays and for specific cognitive tasks. What data are and can do is largely a matter of how they are formatted. To understand our 'datafied' societies, we need to turn our attention to data's formats and the powers of formatting. This book offers an account of one such format: the dashboard. From their first appearance with the horse and carriage, Tkacz guides readers on the historical development of this format. Through analyses of car dashboards, early managerial dashboards, and the gradual emergence of dashboards as a computer display technology, Tkacz shows how today's digital dashboards came to be, and how their cultural history conditions the present.
Highly original and wide-ranging, this book will change how you think about data.
Being with Data — читать онлайн ознакомительный отрывок
Ниже представлен текст книги, разбитый по страницам. Система сохранения места последней прочитанной страницы, позволяет с удобством читать онлайн бесплатно книгу «Being with Data», без необходимости каждый раз заново искать на чём Вы остановились. Поставьте закладку, и сможете в любой момент перейти на страницу, на которой закончили чтение.
Интервал:
Закладка:
My entry point into this data relation and the subsequent questions it opens up is through the format of the dashboard. This format, developed over a few centuries, can help shed light on the way of being with data that I experience when I’m running, and many other places besides. I hope to show that this particular relation, of being with data formatted through a dashboard, is widespread and worthy of sustained attention. Both the concept of ‘format’ and the format of dashboard will therefore play a central role in how the ideas and empirical material that follow are organized. Indeed, my opening gambit is that data and format must be thought together. As much as this is a book about data and ways of being with data, it is a book about the format of dashboards.
Dashboard
Dashboards are generic digital artefacts that facilitate a specific relation to data. Dashboards and dashboard-like interfaces are everywhere, used all the time, by scientists, civil servants, economists, managers, factory workers; and by pretty much anyone who has a phone, tablet or personal computer. They are used for business, leisure and the murky in-betweens. Despite efforts by industry to sell them as part of broader visions of our data-driven future, it’s hard to get too excited by dashboards, comprised as they are of charts, graphs, tables, gauges and ‘key performance indicators’.
You may already know what a dashboard is. If you hail from the overdeveloped regions or are otherwise connected to the digital world, you’ve almost certainly seen one and there’s a very good chance you’ve used one. Perhaps, like me, you have a line manager who uses them to oversee the performance of you and your coworkers, figuring you and them as lines on a graph or pieces of a pie chart. That is, perhaps dashboards know you even if you’re not properly acquainted with them. If you’re lucky, like me, your seniors will tell you about your dashboarded existence and you can look at it together; reflecting on how dashboards quantify the complexities of work; how they arrange and value your activities and outputs. Perhaps you’ve laughed at the shortcomings of dashboards or felt dismayed about a bad comparison or a low indicator.
In recent years, dashboards have been on the move. I first became interested in them around seven years ago. In what now seems like a more innocent time, politically speaking, I remember a colleague showing me a news article on then UK prime minister David Cameron testing a new ‘Number 10 Dashboard’. The first line of the article read: ‘David Cameron is testing an iPad app that helps him run the country.’ 7The No. 10 Dashboard, readers were told, ‘lets Cameron and other ministers see key information at a glance’ and ‘keep track of live data relating to jobs, housing and other areas’. 8A Guardian article similarly reported that the No. 10 Dashboard ‘gives up-to-the-minute data about the UK’s economic and financial health, including GDP, bank lending, jobs and property data, as well as polling data and Twitter feeds’. 9From that point on, I started collecting materials relating to dashboards. I learned of the famous ‘Yellen’s Dashboard’ of Janet Yellen, then chair of the Federal Reserve in the US, for monitoring the labour market, with ‘a dozen of the most important measures of the economy’s vigor’. 10I saw many local councils experimenting with dashboards, quantified-selfers using dashboards, wearable fitness dashboards (such as the one I use while running), mood-app dashboards, pollution dashboards, finance dashboards, personal banking dashboards, voting dashboards – even an activist counter to the No. 10 Dashboard. Once I started paying attention, dashboards were everywhere. Before I knew it, I was knee deep in the business intelligence and analytics industry, where dashboards have been business as usual for a few decades. In a recent study of the proliferation of dashboards, Alper Sarikaya et al. note that while dashboards are ‘ubiquitous’ and ‘built and employed by nearly every industry, non-profit, and service organization to support data-driven decision making’, they are ‘rarely given … their due consideration’. 11
This is a book about dashboards, about what kind of thing they are and what they accomplish as they move across the social fabric, inserting themselves into different settings and contexts. It is about how they mediate our relation to data and how they leave their own mark on those data, formatting these in different ways. For the sake of clarity, I begin with a definition before furthering the case for placing dashboards at the centre of this inquiry. For a book about data and dashboards, this definition should be understood as more of a placeholder than the last word on the matter.
Since dashboards are objects of visual perception, it makes sense to begin with a show-and-tell. Figures 0.1 and 0.2 show two dashboards, courtesy of the business intelligence company Qlik (a company that will occupy more pages below).
Figure 0.1 is a screenshot of a dashboard Qlik uses to demo its product. Figure 0.2 is a photograph I took while attending a training course at Qlik’s UK headquarters in 2015. They are suitably representative in their genericness. A web image search for *dashboard* confirms this (figure 0.3).
A dashboard is first and foremost a visual display. What dashboards display are data, data formatted into specific numbers, words, colours and shapes. A dashboard is not a single visual representation, but a number of visual representations brought together, typically on a single screen. A bar chart may sit next to a scatter plot, below a map, above a key performance indicator (KPI) and so on. Dashboards gather data, often from disparate sources, and bring them into a relation. In order for something to be a dashboard, the visual elements need to be active (and possibly interactive). A poster is not a dashboard. Many data visualizations are not dashboards. A display of measures represented simply by numbers may be a dashboard, even if there are no graphs or gauges. Dashboards change over time. There is a temporality to them. They may strive to accomplish a ‘real-time’ liveliness, but the pace of ‘refreshing’ data varies depending on use. A final quality: dashboards are purposeful things, and their purpose is to enable a cognitive functioning. This is both entirely obvious – dashboards are made for a reason! – and in need of much further elaboration later (in what way are they cognitive?). For now, consider two definitions from within the industry. Stephen Few, who has made a career out of dashboard design, describes dashboards as a ‘single-screen display of the most important information people need to do a job, presented in a way that allows them to monitor what’s going on in an instant’. 12Steve Wexler and his co-authors offer the following: ‘A dashboard is a visual display of data used to monitor conditions and/or facilitate understanding.’ 13In common are not only a visual display bit and a data/information bit but also a function bit: ‘monitor what’s going on in an instant’ and ‘monitor conditions and/or facilitate understanding’. Dashboards are for monitoring and understanding. Later there will be much more to say on the matter, but for the time being this is what I mean by ‘cognitive functioning’. Condensed to the bare essentials, today’s dashboards are comprised of three things: display, data, cognitive function.
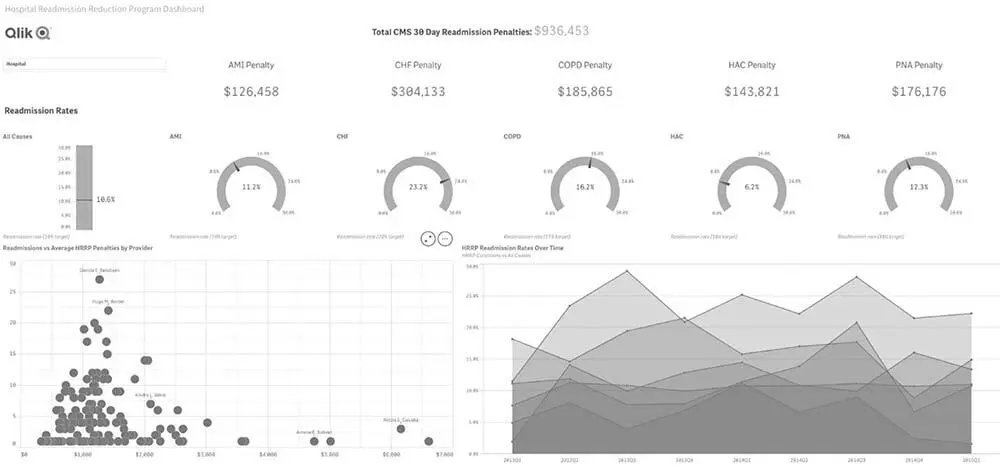
Figure 0.1 Screenshot of Qlik dashboard.
Credit: © 2021 QlikTech International AB, all rights reserved.
Читать дальшеИнтервал:
Закладка:
Похожие книги на «Being with Data»
Представляем Вашему вниманию похожие книги на «Being with Data» списком для выбора. Мы отобрали схожую по названию и смыслу литературу в надежде предоставить читателям больше вариантов отыскать новые, интересные, ещё непрочитанные произведения.

![Элизабет Ленхард - Свидание со смертью[Date With Death]](/books/79651/elizabet-lenhard-svidanie-so-smertyu-date-with-dea-thumb.webp)


Обсуждение, отзывы о книге «Being with Data» и просто собственные мнения читателей. Оставьте ваши комментарии, напишите, что Вы думаете о произведении, его смысле или главных героях. Укажите что конкретно понравилось, а что нет, и почему Вы так считаете.