Steve Bell - Quantitative Finance For Dummies
Здесь есть возможность читать онлайн «Steve Bell - Quantitative Finance For Dummies» — ознакомительный отрывок электронной книги совершенно бесплатно, а после прочтения отрывка купить полную версию. В некоторых случаях можно слушать аудио, скачать через торрент в формате fb2 и присутствует краткое содержание. ISBN: , Жанр: foreign_edu, на английском языке. Описание произведения, (предисловие) а так же отзывы посетителей доступны на портале библиотеки ЛибКат.
- Название:Quantitative Finance For Dummies
- Автор:
- Жанр:
- Год:неизвестен
- ISBN:9781118769430
- Рейтинг книги:3 / 5. Голосов: 1
-
Избранное:Добавить в избранное
- Отзывы:
-
Ваша оценка:
Quantitative Finance For Dummies: краткое содержание, описание и аннотация
Предлагаем к чтению аннотацию, описание, краткое содержание или предисловие (зависит от того, что написал сам автор книги «Quantitative Finance For Dummies»). Если вы не нашли необходимую информацию о книге — напишите в комментариях, мы постараемся отыскать её.
Quantitative Finance For Dummies — читать онлайн ознакомительный отрывок
Ниже представлен текст книги, разбитый по страницам. Система сохранения места последней прочитанной страницы, позволяет с удобством читать онлайн бесплатно книгу «Quantitative Finance For Dummies», без необходимости каждый раз заново искать на чём Вы остановились. Поставьте закладку, и сможете в любой момент перейти на страницу, на которой закончили чтение.
Интервал:
Закладка:
 .
.
In common practice, I use the capital Greek letter sigma, Σ, to indicate a summation. This formula follows from the fact that the sum of the probabilities of all possible outcomes must be one.
You can also calculate the probability of a number of events. For example, if tossing a coin and turning up heads is P(H) = 0.5, then the probability of tossing two heads in succession is P(H)P(H) = 0.5 × 0.5 = 0.25. Because landing a head on the first toss is independent of whether you land a head on the second toss, you must multiply the probability of the individual events to get the probability of the joint event of getting two heads. Independence is an important concept in quantitative finance. You can frequently assume that the return of a financial asset on a given day is independent of the return on the previous day.
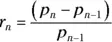
 The most common definition for the return, r n, of a financial asset on day, n, in terms of the price, p n, on day n is:
 .
.
Likewise, the probability of tossing two tails in succession is P(T)P(T) = 0.5 × 0.5 = 0.25. You need to take care in figuring the probability of tossing a head and a tail. Either the head or the tail can be tossed first, so you have two ways of getting a head and a tail. In the case of tossing a head first P(H)P(T) = 0.5 × 0.5 = 0.25 and a tail first P(T)P(H) = 0.5 × 0.5 = 0.25. Adding up these two probabilities P(T)P(H) + P(H)P(T) = 0.5 gives you the probability of a head and a tail, irrespective of which face came up first.
Applying these ideas to a die, you can calculate the probability of rolling either a three or a four, for example. To do this, you add the probabilities because the events of rolling a three or a four are disjoint , meaning that they’re completely different and can’t happen together. So the probability of rolling either a three or a four is 1/6 + 1/6 = 1/3.
When I calculated the probability of both heads and tails in two tosses, I came up with the number 0.5. I got this answer using the idea of disjoint events – the event of tossing a head first and then a tail is disjoint from first tossing a tail and then a head. So you must add the probabilities of these events to get the overall probability of getting a head and a tail in two tosses.
To make this clear in another way, use the example of a deck of cards. The probability of drawing a king or a spade isn’t simply P(King)+P(Spade) because, of course, you can draw the king of spades. So the events of drawing a king or a spade are not disjoint and you need to take into account the probability of drawing the king of spades.
 Probability can be summarised in a few short statements:
❯❯ A probability is a number between zero and one.
❯❯ For a certain event, the probability is exactly one.
❯❯ For disjoint events, the probability of at least one event happening is the sum of the individual probabilities for the events.
❯❯ For independent events, the probability of both of them happening is the product of the individual probabilities for the events.
You may find it amazing, but that’s all you really need to know about probability.
Playing a game
Now that you’re familiar with coin flipping, I’d like to challenge you to a game. I’ll flip a coin again and again until it turns up heads. If it turns up heads on the first flip, I’ll give you £2. If it turns up heads for the first time on the second flip, I’ll give you £4. If it turns up heads for the first time on the third flip, I’ll give you £2 3= £8. And if it turns up heads on the nth flip I’ll give you £2 n. How much are you prepared to pay me to play this game?
To work out how much you may win, you need to calculate some probabilities. The probability of the coin turning up heads is always 0.5, and the probability the coin turns up tails is also 0.5. If heads appears first on the nth (say, third) flip, then all previous flips must have been tails. The probability of that is 1/2 (n-1)(so 0.5 2if n = 3). You must now multiply again by 0.5 to get the probability of heads on the nth flip preceded by tails on the previous (n–1) flips. This works out as 1/2 n(so 0.5 × 0.5 2= 0.5 3if n = 3).
So, heads turn up for the first time on the nth flip with probability 1/2 n. If heads turns up first on the nth flip, then you win £2 n. The total expected pay-off (the amount, on average, you receive for winning) is then:
£2/2 + £2 2/2 2+ £2 3/2 3+ …
However, this is just a series of 1s going on forever that adds up to infinity. So, then, would you pay me your life savings to play this game in the hope of a staggering return? If heads came up first, you may be disappointed at receiving a mere £2 for your savings; but if you had to wait a long time for heads to turn up but eventually it did and you were due a substantial pay off, I may not be able to pay out your winnings. I don’t think that the Central Bank would print large amounts of money to help me out. This is an extreme example in which an unlikely event plays a significant role. You may notice a spooky similarity to certain recent events in financial markets even though this game was invented several hundred years ago.
Flipping more coins
Another fun experiment with a coin is to keep on flipping it again and again to see how many times heads comes up. Sometimes heads follows tails and at other times there can be long series of either heads or tails.
During long sequences of heads or tails, you can easily believe that you have a higher than average probability of the other side turning up to even things up a bit. This gambler’s fallacy , however, isn’t valid. The coin has no memory. On each flip, the probability of heads remains 0.5, as does the probability for tails.
An important idea that comes out of experimenting with gambling games is the Law of Large Numbers . It states that the average result from a large number of trials (such as coin tossing) should be close to the expected value (0.5 for tossing heads) and will become closer as more trials are performed. I’ll show you how this works.
If H nis the total number of heads (for example, 4) in the first n tosses (for example, 8) then H n/n should tend towards 0.5 (so, 4/8 = 0.5). Figure 2-1graphs 1,000 coin tosses.
© John Wiley & Sons, Ltd.
FIGURE 2-1: Convergence of the proportion of tossed coins landing heads up.
The chart fluctuates less and less after more coin flips and the fraction of heads converges (gets closer and closer) towards 0.5. This is an example of the Law of Large Numbers. You’d be surprised though at how many tosses it takes for the chart to settle down to the expected average.
I examine this further by plotting H n– n/2 where n/2 is the expected number of heads after n tosses. The line in Figure 2-2
Конец ознакомительного фрагмента.
Текст предоставлен ООО «ЛитРес».
Прочитайте эту книгу целиком, купив полную легальную версию на ЛитРес.
Читать дальшеИнтервал:
Закладка:
Похожие книги на «Quantitative Finance For Dummies»
Представляем Вашему вниманию похожие книги на «Quantitative Finance For Dummies» списком для выбора. Мы отобрали схожую по названию и смыслу литературу в надежде предоставить читателям больше вариантов отыскать новые, интересные, ещё непрочитанные произведения.


Обсуждение, отзывы о книге «Quantitative Finance For Dummies» и просто собственные мнения читателей. Оставьте ваши комментарии, напишите, что Вы думаете о произведении, его смысле или главных героях. Укажите что конкретно понравилось, а что нет, и почему Вы так считаете.