Михаил Попов - Working Day Reduction as the Ground of Modern Economic Development
Здесь есть возможность читать онлайн «Михаил Попов - Working Day Reduction as the Ground of Modern Economic Development» весь текст электронной книги совершенно бесплатно (целиком полную версию без сокращений). В некоторых случаях можно слушать аудио, скачать через торрент в формате fb2 и присутствует краткое содержание. Год выпуска: 2021, Жанр: Политика, economics, на английском языке. Описание произведения, (предисловие) а так же отзывы посетителей доступны на портале библиотеки ЛибКат.
- Название:Working Day Reduction as the Ground of Modern Economic Development
- Автор:
- Жанр:
- Год:2021
- ISBN:нет данных
- Рейтинг книги:3 / 5. Голосов: 1
-
Избранное:Добавить в избранное
- Отзывы:
-
Ваша оценка:
Working Day Reduction as the Ground of Modern Economic Development: краткое содержание, описание и аннотация
Предлагаем к чтению аннотацию, описание, краткое содержание или предисловие (зависит от того, что написал сам автор книги «Working Day Reduction as the Ground of Modern Economic Development»). Если вы не нашли необходимую информацию о книге — напишите в комментариях, мы постараемся отыскать её.
This monograph is for students, post-graduates, scientists, officers of state and municipal authority, participants of trade union movement.
Working Day Reduction as the Ground of Modern Economic Development — читать онлайн бесплатно полную книгу (весь текст) целиком
Ниже представлен текст книги, разбитый по страницам. Система сохранения места последней прочитанной страницы, позволяет с удобством читать онлайн бесплатно книгу «Working Day Reduction as the Ground of Modern Economic Development», без необходимости каждый раз заново искать на чём Вы остановились. Поставьте закладку, и сможете в любой момент перейти на страницу, на которой закончили чтение.
Интервал:
Закладка:
In spite of broad utilization of scientific and technological progress in domestic labour, saving of labour in this sector has lower tempos than in production for social needs. The reason is in an impossibility of adequate realization of a positive effect of the scale. New tools used in domestic labour would save labour of many people if they would work continuously, but they are used for needs of one family and stand idle most of the time.
Because of large-scaled volumes of domestic labour it is not enough to judge the dynamics of expenditures of labour used in production of benefits in the scale of the whole society by expenditures of paid labour, it is necessary to take into account the first kind of productive activities too. Considering limited data on time budgets and low effect from using new tools in domestic labour we shall consider that total expenditures of such labour change only because of changing in population of the examined European countries and Korea during the analyzed period – 1993-2007.
Annual time budgets of population of the USA are available since 2003. It is supposed that indices of 1993 are equal to indices of 2003. As we noticed before, the data of time budgets of the USA are spread to Canada too.
Table 8
The Dynamics of Labour Expenditures in Production of Several Economically Developed Countries (1993-2007)
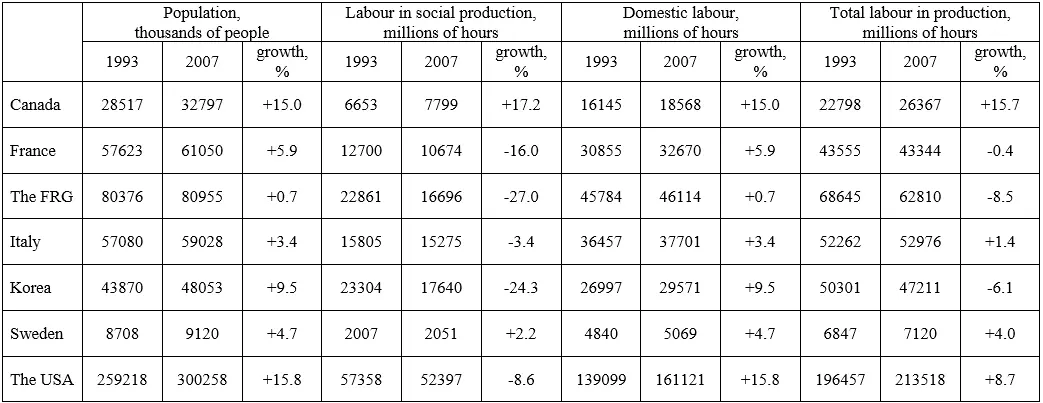
Thus, saving of labour in social production is seen in most of the countries above, at that, in France, the FRG, and Korea it goes with high rates. Canada with its essential increase in labour expenditures in this sphere is an exception.
At the prerequisite of absence of domestic labour saving growth of population leads to increasing in total values of this activity. As a result, total labour expenditures in most of the countries grow and if they decrease, then it goes much slower than in social production. In this context the regularity of absolute reduction of the working time fund in production appears not so regular, as it happens in manufacturing industries.
At the same time, growth of population in most cases (except for Canada) outstripped growth of total labour expenditures. Consequently, labour expenditures in production decreased per capita. Formation of prerequisites of economic development connected to enhancing abilities for free development of all members of the society goes on.
1.3. Saving of Labour in Production is the Basis of Progress in the Nonproduction Sphere
The Ratio of General Labour Expenditures in the Sphere of Production and Services
Decreasing in general labour expenditures in the production sphere along with increasing in output per capita represents releasing of labour for activities in the sphere of services and leisure. In process of this release total time spent on labour in the nonproduction sphere starts prevailing over the working time fund in production.
The fact of this prevalence can be fixed by means of comparing employment in different spheres of the economy supposing reasonably that working time in different spheres per one employee differs insignificantly.
All economically developed countries have high values of a part of employees in the services sphere – 68-70% and more. In other words, countries with a high level of labour productivity in manufacturing industries have an opportunity to spend the main part of their economic activities on rendering services and on other kinds of nonproductive activities.
Domination of the services sphere reflects the dynamics of the employment structure in the economy what the data at table 9 show.
Thus, for the period of 1993-2009 in all the countries given at table 9 employment in the nonproduction sphere, having already been prevailing over employment in production, went on increasing relative to the second. Tempos of such an increase were the higher the less significant prevalence of the first sphere was in 1993. That was why Korea and the FRG were leaders in tempos of increasing in the part of employment in the nonproductive sector and the highest level of employment was in the USA, France and Sweden.
These indices reflect changes in the ratio of the working time fund in the production and nonproduction spheres: the process of transforming saving of production labour into growth of labour volumes in the nonproduction sector continues.
Table 9
The Dynamics of Employment in the Main Spheres of the Economy in Particular Economically Developed Countries of the World during 1993-2009, %
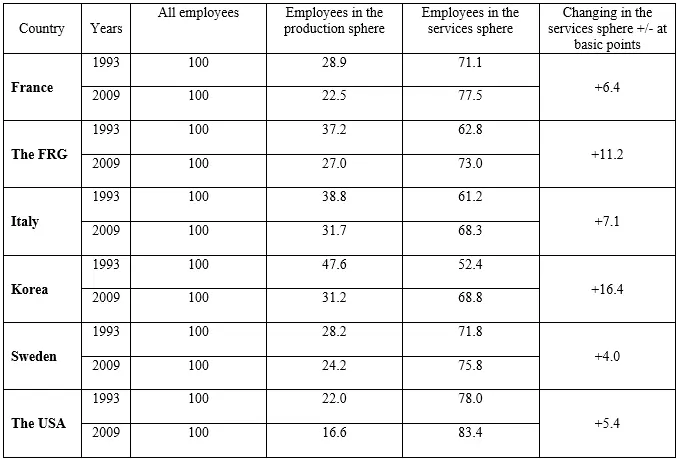
Source: calculated on the basis of statistics of the Organization for Economic Co-operation and Development (OECD)[Electronic resource]. – Access mode: http://stats.oecd.org/
Assessment of the absolute value of this transformation, based on the employment dynamics, is not fully correct. First, reduction of working time per one employee is not considered at that. For example, if there was reduction of its duration, then the absolute value of the working time fund in production would decrease more significantly than it can be judged according to decreasing in employment in it. Tempos of growth of employment in the services sphere would similarly be higher than tempos of increasing in total labour time in it.
Second, saving of labour in production can be used not only for increasing in employment in the nonproduction sphere but for expanding scales of noneconomic activities, for example, getting an education.
That is why to get a more accurate assessment of the ratio of working time volumes in the basic spheres of the economy it would be better to measure them in hours.
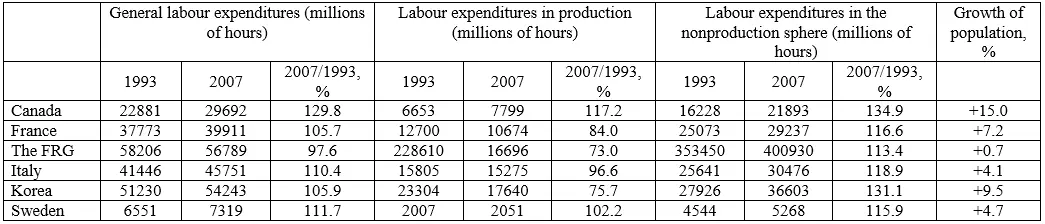
First of all, it is appropriate to examine the dynamics of the values reflected by the data at table 10.
As it follows from the data, in all the countries labour expenditures in the nonproduction sphere were increasing and, at the same time, total working time in production of the most countries (except for Canada and Sweden) was reducing. At the same time, in Canada and Sweden outpacing growth of labour expenditures in this sphere meant relative reduction of the working time fund of paid labour in production.
Working time in production was reducing in all the countries, except for Canada, and the similar value of labour in the nonproduction sphere was increasing per capita. In Korea, France, and the FRG time of economic development was decreasing per capita; at equal other conditions, it meant increasing in time of noneconomic social activities including education, leisure (in the narrow sense), etc. On the contrary, in Canada, Italy, and Sweden time of paid economic activities increased per capita and time of noneconomic activities decreased.
Table 10
The Dynamics of General Expenditures of Paid Labour in the Economy in General, in Production and the Nonproduction Sphere in Several Economically Developed Countries during the Period of 1993-2007
Economic activities, i.e., activities connected to production of goods and rendering services, are not restricted only with paid activities typical for the category “economically active population”. Labour in housekeeping and rendering services on the gratuitous basis exist. That is why to characterize processes of economic development more accurately calculation of the rate of free time of the society, taking into account all components of social activities, is needed.
Читать дальшеИнтервал:
Закладка:
Похожие книги на «Working Day Reduction as the Ground of Modern Economic Development»
Представляем Вашему вниманию похожие книги на «Working Day Reduction as the Ground of Modern Economic Development» списком для выбора. Мы отобрали схожую по названию и смыслу литературу в надежде предоставить читателям больше вариантов отыскать новые, интересные, ещё непрочитанные произведения.


Обсуждение, отзывы о книге «Working Day Reduction as the Ground of Modern Economic Development» и просто собственные мнения читателей. Оставьте ваши комментарии, напишите, что Вы думаете о произведении, его смысле или главных героях. Укажите что конкретно понравилось, а что нет, и почему Вы так считаете.