Нассим Талеб - The Black Swan. The Impact of the Highly Improbable
Здесь есть возможность читать онлайн «Нассим Талеб - The Black Swan. The Impact of the Highly Improbable» весь текст электронной книги совершенно бесплатно (целиком полную версию без сокращений). В некоторых случаях можно слушать аудио, скачать через торрент в формате fb2 и присутствует краткое содержание. Год выпуска: 2010, Издательство: Random House Publishing Group, Жанр: Политика, Публицистика, на английском языке. Описание произведения, (предисловие) а так же отзывы посетителей доступны на портале библиотеки ЛибКат.
- Название:The Black Swan. The Impact of the Highly Improbable
- Автор:
- Издательство:Random House Publishing Group
- Жанр:
- Год:2010
- ISBN:нет данных
- Рейтинг книги:3 / 5. Голосов: 1
-
Избранное:Добавить в избранное
- Отзывы:
-
Ваша оценка:
The Black Swan. The Impact of the Highly Improbable: краткое содержание, описание и аннотация
Предлагаем к чтению аннотацию, описание, краткое содержание или предисловие (зависит от того, что написал сам автор книги «The Black Swan. The Impact of the Highly Improbable»). Если вы не нашли необходимую информацию о книге — напишите в комментариях, мы постараемся отыскать её.
The astonishing success of Google was a black swan; so was 9/11. For Nassim Nicholas Taleb, black swans underlie almost everything about our world, from the rise of religions to events in our own personal lives.
Why do we not acknowledge the phenomenon of black swans until after they occur? Part of the answer, according to Taleb, is that humans are hardwired to learn specifics when they should be focused on generalities.
We concentrate on things we already know and time and time again fail to take into consideration what we don’t know. We are, therefore, unable to truly estimate opportunities, too vulnerable to the impulse to simplify, narrate, and categorize, and not open enough to rewarding those who can imagine the “impossible.”
For years, Taleb has studied how we fool ourselves into thinking we know more than we actually do. We restrict our thinking to the irrelevant and inconsequential, while large events continue to surprise us and shape our world. Now, in this revelatory book, Taleb explains everything we know about what we don’t know. He offers surprisingly simple tricks for dealing with black swans and benefiting from them.
Elegant, startling, and universal in its applications The Black Swan will change the way you look at the world. Taleb is a vastly entertaining writer, with wit, irreverence, and unusual stories to tell. He has a polymathic command of subjects ranging from cognitive science to business to probability theory.
The Black Swan is a landmark book – itself a black swan.
The Black Swan. The Impact of the Highly Improbable — читать онлайн бесплатно полную книгу (весь текст) целиком
Ниже представлен текст книги, разбитый по страницам. Система сохранения места последней прочитанной страницы, позволяет с удобством читать онлайн бесплатно книгу «The Black Swan. The Impact of the Highly Improbable», без необходимости каждый раз заново искать на чём Вы остановились. Поставьте закладку, и сможете в любой момент перейти на страницу, на которой закончили чтение.
Интервал:
Закладка:
* The Web’s bottom-up feature is also making book reviewers more accountable. While writers were helpless and vulnerable to the arbitrariness of book reviews, which can distort their messages and, thanks to the confirmation bias, expose small irrelevant weak points in their text, they now have a much stronger hand. In place of the moaning letter to the editor, they can simply post their review of a review on the Web. If attacked ad hominem, they can reply ad hominem and go directly after the credibility of the reviewer, making sure that their statement shows rapidly in an Internet search or on Wikipedia, the bottom-up encyclopedia.
* As if we did not have enough problems, banks are now more vulnerable to the Black Swan and the ludic fallacy than ever before with “scientists” among their staff taking care of exposures. The giant firm J. P. Morgan put the entire world at risk by introducing in the nineties RiskMetrics, a phony method aiming at managing people’s risks, causing the generalized use of the ludic fallacy, and bringing Dr. Johns into power in place of the skeptical Fat Tonys. (A related method called “Value-at-Risk,” which relies on the quantitative measurement of risk, has been spreading.) Likewise, the government-sponsored institution Fanny Mae, when I look at their risks, seems to be sitting on a barrel of dynamite, vulnerable to the slightest hiccup. But not to worry: their large staff of scientists deemed these events “unlikely.”
Chapter Fifteen

THE BELL CURVE, THAT GREAT INTELLECTUAL FRAUD *
Not worth a pastis—Quételet’s error—The average man is a monster—Let’s deify it—Yes or no—Not so literary an experiment
Forget everything you heard in college statistics or probability theory. If you never took such a class, even better. Let us start from the very beginning.
THE GAUSSIAN AND THE MANDELBROTIAN
I was transiting through the Frankfurt airport in December 2001, on my way from Oslo to Zurich.
I had time to kill at the airport and it was a great opportunity for me to buy dark European chocolate, especially since I have managed to successfully convince myself that airport calories don’t count. The cashier handed me, among other things, a ten deutschmark bill, an (illegal) scan of which can be seen on the next page. The deutschmark banknotes were going to be put out of circulation in a matter of days, since Europe was switching to the euro. I kept it as a valedictory. Before the arrival of the euro, Europe had plenty of national currencies, which was good for printers, money changers, and of course currency traders like this (more or less) humble author. As I was eating my dark European chocolate and wistfully looking at the bill, I almost choked. I suddenly noticed, for the first time, that there was something curious about it. The bill bore the portrait of Carl Friedrich Gauss and a picture of his Gaussian bell curve.
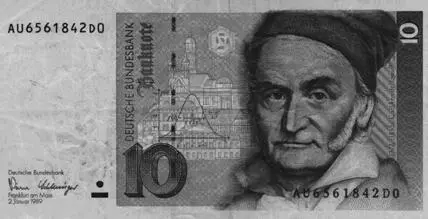
The last ten deutschmark bill, representing Gauss and, to his right, the bell curve of Mediocristan.
The striking irony here is that the last possible object that can be linked to the German currency is precisely such a curve: the reichsmark (as the currency was previously called) went from four per dollar to four trillion per dollar in the space of a few years during the 1920s, an outcome that tells you that the bell curve is meaningless as a description of the randomness in currency fluctuations. All you need to reject the bell curve is for such a movement to occur once, and only once—just consider the consequences. Yet there was the bell curve, and next to it Herr Professor Doktor Gauss, unprepossessing, a little stern, certainly not someone I’d want to spend time with lounging on a terrace, drinking pastis, and holding a conversation without a subject.
Shockingly, the bell curve is used as a risk-measurement tool by those regulators and central bankers who wear dark suits and talk in a boring way about currencies.
The Increase in the Decrease
The main point of the Gaussian, as I’ve said, is that most observations hover around the mediocre, the average; the odds of a deviation decline faster and faster (exponentially) as you move away from the average. If you must have only one single piece of information, this is the one: the dramatic increase in the speed of decline in the odds as you move away from the center, or the average. Look at the list below for an illustration of this. I am taking an example of a Gaussian quantity, such as height, and simplifying it a bit to make it more illustrative. Assume that the average height (men and women) is 1.67 meters, or 5 feet 7 inches. Consider what I call a unit of deviation here as 10 centimeters. Let us look at increments above 1.67 meters and consider the odds of someone being that tall. *
10 centimeters taller than the average (i.e., taller than 1.77 m, or 5 feet 10): 1 in 6.3
20 centimeters taller than the average (i.e., taller than 1.87 m, or 6 feet 2): 1 in 44
30 centimeters taller than the average (i.e., taller than 1.97 m, or 6 feet 6): 1 in 740
40 centimeters taller than the average (i.e., taller than 2.07 m, or 6 feet 9): 1 in 32,000
50 centimeters taller than the average (i.e., taller than 2.17 m, or 7 feet 1): 1 in 3,500,000
60 centimeters taller than the average (i.e., taller than 2.27 m, or 7 feet 5): 1 in 1,000,000,000
70 centimeters taller than the average (i.e., taller than 2.37 m, or 7 feet 9): 1 in 780,000,000,000
80 centimeters taller than the average (i.e., taller than 2.47 m, or 8 feet 1): 1 in 1,600,000,000,000,000
90 centimeters taller than the average (i.e., taller than 2.57 m, or 8 feet 5): 1 in 8,900,000,000,000,000,000
100 centimeters taller than the average (i.e., taller than 2.67 m, or 8 feet 9): 1 in 130,000,000,000,000,000,000,000
… and,
110 centimeters taller than the average (i.e., taller than 2.77 m, or 9 feet 1): 1 in 36,000,000,000,000,000,000,000,000,000,000,000, 000,000,000,000,000,000,000,000,000,000,000,000,000,000,000, 000,000,000.
Note that soon after, I believe, 22 deviations, or 220 centimeters taller than the average, the odds reach a googol, which is 1 with 100 zeroes behind it.
The point of this list is to illustrate the acceleration. Look at the difference in odds between 60 and 70 centimeters taller than average: for a mere increase of four inches, we go from one in 1 billion people to one in 780 billion! As for the jump between 70 and 80 centimeters: an additional 4 inches above the average, we go from one in 780 billion to one in 1.6 million billion! *
This precipitous decline in the odds of encountering something is what allows you to ignore outliers. Only one curve can deliver this decline, and it is the bell curve (and its nonscalable siblings).
The Mandelbrotian
By comparison, look at the odds of being rich in Europe. Assume that wealth there is scalable, i.e., Mandelbrotian. (This is not an accurate description of wealth in Europe; it is simplified to emphasize the logic of scalable distribution.) †
Scalable Wealth Distribution
People with a net worth higher than €1 million: 1 in 62.5
Higher than €2 million: 1 in 250
Higher than €4 million: 1 in 1,000
Higher than €8 million: 1 in 4,000
Higher than €16 million: 1 in 16,000
Higher than €32 million: 1 in 64,000
Читать дальшеИнтервал:
Закладка:
Похожие книги на «The Black Swan. The Impact of the Highly Improbable»
Представляем Вашему вниманию похожие книги на «The Black Swan. The Impact of the Highly Improbable» списком для выбора. Мы отобрали схожую по названию и смыслу литературу в надежде предоставить читателям больше вариантов отыскать новые, интересные, ещё непрочитанные произведения.


Обсуждение, отзывы о книге «The Black Swan. The Impact of the Highly Improbable» и просто собственные мнения читателей. Оставьте ваши комментарии, напишите, что Вы думаете о произведении, его смысле или главных героях. Укажите что конкретно понравилось, а что нет, и почему Вы так считаете.