Helen Caldicott - Crisis Without End
Здесь есть возможность читать онлайн «Helen Caldicott - Crisis Without End» весь текст электронной книги совершенно бесплатно (целиком полную версию без сокращений). В некоторых случаях можно слушать аудио, скачать через торрент в формате fb2 и присутствует краткое содержание. Город: New York, Год выпуска: 2014, ISBN: 2014, Издательство: The New Press, Жанр: Медицина, sci_ecology, на английском языке. Описание произведения, (предисловие) а так же отзывы посетителей доступны на портале библиотеки ЛибКат.
- Название:Crisis Without End
- Автор:
- Издательство:The New Press
- Жанр:
- Год:2014
- Город:New York
- ISBN:978-1-59558-970-5
- Рейтинг книги:5 / 5. Голосов: 1
-
Избранное:Добавить в избранное
- Отзывы:
-
Ваша оценка:
Crisis Without End: краткое содержание, описание и аннотация
Предлагаем к чтению аннотацию, описание, краткое содержание или предисловие (зависит от того, что написал сам автор книги «Crisis Without End»). Если вы не нашли необходимую информацию о книге — напишите в комментариях, мы постараемся отыскать её.
The only document of its kind,
represents an unprecedented look into the profound aftereffects of Fukushima. In accessible terms, leading experts from Japan, the United States, Russia, and other nations weigh in on the current state of knowledge of radiation-related health risks in Japan, impacts on the world’s oceans, the question of low-dosage radiation risks, crucial comparisons with Chernobyl, health and environmental impacts on the United States (including on food and newborns), and the unavoidable implications for the U.S. nuclear energy industry.
Crisis Without End
Crisis Without End — читать онлайн бесплатно полную книгу (весь текст) целиком
Ниже представлен текст книги, разбитый по страницам. Система сохранения места последней прочитанной страницы, позволяет с удобством читать онлайн бесплатно книгу «Crisis Without End», без необходимости каждый раз заново искать на чём Вы остановились. Поставьте закладку, и сможете в любой момент перейти на страницу, на которой закончили чтение.
Интервал:
Закладка:
Hard to believe, isn’t it? Remember, these nuclear poisons are lethal at the atomic level. There are roughly as many atoms in one gram of cesium-137 (4.39 x 10 21atoms) as there are grains of sand on all the beaches of the world. This means that if one gram of cesium-137 is evenly spread over a square mile, there will be about 1.42 quadrillion (1.42 x 10 15) atoms of cesium-137 per square yard of the contaminated square mile. This works out to about 100,000 disintegrations per second per square yard within this square mile from cesium-137 recently released from a fuel rod inside a destroyed nuclear reactor. The number of atomic disintegrations per second will slowly decrease with time as the cesium-137 self-destructs.
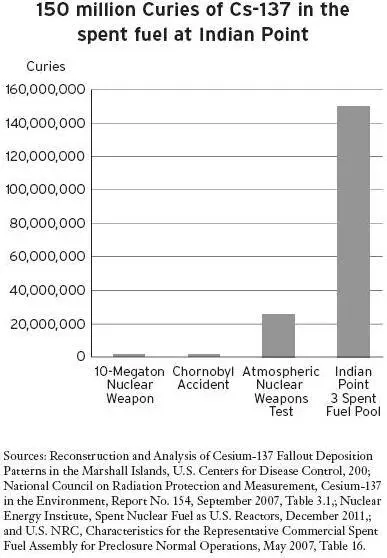
Figure 5.3 illustrates the immense inventories of cesium-137, about 150 million curies, in the form of spent nuclear fuel, located at Indian Point nuclear power plant, which is forty-seven miles from New York City as the radioactive cloud flies. Many of the 104 U.S. commercial nuclear power plants have more than 100 million curies of cesium-137 in their spent-fuel pools. Note that 150 curies of cesium-137 is equal to about 1.7 million grams of cesium-137—a quantity many times greater than that contained within any of the spent pools sitting next to the destroyed reactors at Fukushima Daiichi.
It is now widely recognized that the nuclear reactors 1, 2, and 3 at Fukushima Daiichi all melted down and melted through their steel reactor vessels within a few days following the earthquake and tsunami of March 11, 2011. This was not made public by either TEPCO or the Japanese government until May 17, 2011, more than two months after the meltdowns and melt-throughs occurred. During these two months, TEPCO continually stated that it was “trying to prevent a meltdown” of the reactors and was not contradicted by Japanese government officials. [13] “The Big Picture,” RT.com, May 17, 2011, retrieved from http://www.youtube.com/watch?v=xEFtfkJc4kM .
The greatest amounts of highly radioactive gases and aerosols were released shortly after the meltdowns occurred. Approximately 80 percent of the radioactive material initially released by the reactors is believed to have traveled away from Japan, over the Pacific. However, the remaining 20 percent was dispersed over the Japanese mainland.
On March 11, the U.S. National Nuclear Security Administration offered the use of its NA-42 Aerial Measuring System to the Japanese government, and the National Atmospheric Release Advisory Center (NARAC) of the Lawrence Livermore National Laboratory stood up to provide atmospheric modeling projections. With the help of American technical means, Lawrence Livermore was able to produce detailed and timely estimates of the radiation plumes emanating from the destroyed reactors, and presumably these were given to the Japanese government.
Scientists at Lawrence Livermore have published a Power-Point of their computer models that includes a distinct image of the highly radioactive plume from Fukushima blowing south over the Tokyo metropolitan area on March 14, 2011. All the areas that the radioactive plume passed over were contaminated, but it appears that the heaviest contamination was deposited outside the metropolitan area, where rainfall occurred. [14] These scientists declined my request to republish the image here, but it can be found online as slide number 25 in Gayle Sugiyama and John Nasstrom, “Overview of the NARAC Modeling During the Response to the Fukushima Dai-ichi Power Plant Emergency,” International Workshop on Source Term Estimation Methods for Estimating the Atmospheric Radiation Release from the Fukushima Daiichi Nuclear Power Plant, February 22–24, 2012, http://www.ral.ucar.edu/nsap/events/fukushima/documents/Session1_Briefing3-Sugiyama.pdf .
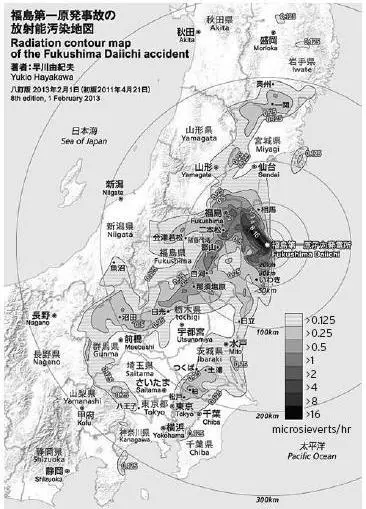
Eight months after the disaster, the Japanese science ministry released a map detailing the fallout, which showed that 11,580 square miles (30,000 square kilometers)—equaling 13 percent of the Japanese mainland—had been contaminated with cesium-137. The official map does not indicate any cesium-137 contamination in the Tokyo metropolitan area, unlike an unofficial survey done at about the same time by Professor Yukio Hayakawa of Gunma University. Given the fact that the Japanese government and TEPCO denied for two months that any meltdowns had occurred at Fukushima, one must look at all official data with a healthy degree of skepticism.
The official data admits that 4,500 square miles—an area almost the size of Connecticut—were found to have radiation levels that exceeded Japan’s previously allowable exposure rate of 1 millisievert per year. [15] One millisievert per year is similar to current U.S. radiation safety exposure standards.
Rather than evacuate this area, Japan chose to raise its acceptable radiation-exposure rate by twenty times, from 1 millisievert to 20 millisieverts per year.
Although Japan avoided evacuating this large contaminated region, approximately 200 square miles adjacent to the destroyed Fukushima reactors remain so contaminated that they have been declared uninhabitable. More than 160,000 Japanese people were initially evicted from this radioactive “exclusion zone” in May 2011. [16] This figure was provided to me by the former Japanese ambassador to Switzerland Mitsuhei Murata, who obtained these figures from government officials in Fukushima Prefecture.
As of October, some 83,000 still remained homeless, having also lost their property and businesses, and most have received only a small compensation to cover the cost of living as evacuees. [17] M. Fackler, “Japan’s Nuclear Refugees, Still Stuck in Limbo,” New York Times , October 1, 2013.
What is the increased health risk to Japanese people based upon their exposure to 20 millisieverts per year? According to the Nuclear Information and Resource Service (NIRS) and Physicians for Social Responsibility (PSR), 20 millisieverts per year is the equivalent of approximately one thousand chest X-rays annually, or three chest X-rays every day of your life. NIRS and PSR state that according to data from the National Academy of Sciences, 20 millisieverts over a lifetime will produce an excess cancer in one in every six people exposed. [18] Comments by the Committee to Bridge the Gap, NIRS, PSR Los Angeles, and the Southern California Federation of Scientists on the National Council on Radiation Protection and Measurements’s draft report SC 5-1, “Approach to Optimizing Decision Making for Late-Phase Recovery from Nuclear or Radiological Terrorism Incidents,” April 2013.
Let us also examine figures constructed on the basis of data published by the National Academy of Sciences. In figure 5.5, the vertical Y-axis is calibrated to the number of cancer cases per one hundred thousand age-peers, and the horizontal X-axis depicts the age of the population, beginning at zero years and moving toward old age. Note the allegedly safe dose of twenty millisieverts per year. As a result of this exposure, there will be about one thousand additional cases of cancer in female infants and five hundred cases of cancer in infant boys per one hundred thousand in their age group. There will be an additional one hundred cases of cancer in thirty-year-old males per one hundred thousand in this age peer group.
Читать дальшеИнтервал:
Закладка:
Похожие книги на «Crisis Without End»
Представляем Вашему вниманию похожие книги на «Crisis Without End» списком для выбора. Мы отобрали схожую по названию и смыслу литературу в надежде предоставить читателям больше вариантов отыскать новые, интересные, ещё непрочитанные произведения.


![Helen Rowland - The Widow [To Say Nothing of the Man]](/books/752764/helen-rowland-the-widow-to-say-nothing-of-the-man-thumb.webp)
Обсуждение, отзывы о книге «Crisis Without End» и просто собственные мнения читателей. Оставьте ваши комментарии, напишите, что Вы думаете о произведении, его смысле или главных героях. Укажите что конкретно понравилось, а что нет, и почему Вы так считаете.